In the dynamic and volatile world of cryptocurrency trading, speed and precision are of the essence. Traders are constantly seeking effective strategies that can help them maximize profits in the shortest time possible. One such strategy that has gained popularity among day traders is the 5-minute scalping strategy. This article aims to provide a detailed exploration of this strategy, focusing on two specific indicators: the Nadaraya Watson Envelope by Lux Algo and the Relative Strength Index (RSI).
Understanding the Basics of Scalping
Before we delve into the specifics of the 5-minute scalping strategy, it’s crucial to understand what scalping in trading means. Scalping is a trading style that specializes in profiting off small price changes, generally soon after a trade has been entered and becomes profitable. It requires a strict exit strategy as a large loss can eliminate many small gains the trader worked to obtain. Thus, scalpers operate on short time frames, entering and exiting trades rapidly throughout the day.
The Role of Indicators in Trading
In the world of trading, indicators serve as invaluable tools that help traders make informed decisions. They provide data-driven insights into market trends, price patterns, and potential entry and exit points. The 5-minute scalping strategy we’re discussing today relies on two such indicators: the Nadaraya Watson Envelope by Lux Algo and the Relative Strength Index (RSI).
Why Are Trading Indicators Important?
Trading indicators are essential for several reasons. Firstly, they provide objective, data-driven insights into market trends, helping traders identify potential trading opportunities. Secondly, they can help traders determine optimal entry and exit points for their trades, maximizing their potential profits and minimizing their risks. Lastly, they can help traders understand the overall market sentiment, whether it’s bullish, bearish, or neutral.
The Nadaraya Watson Envelope and RSI: Two Key Indicators
The Nadaraya Watson Envelope by Lux Algo and the Relative Strength Index (RSI) are two such indicators that play a crucial role in the 5-minute scalping strategy.
The Nadaraya Watson Envelope: A Volatility-Based Indicator
The Nadaraya Watson Envelope is a volatility-based indicator that aids traders in identifying market trends and potential reversals. But what does it mean for an indicator to be ‘volatility-based’? In essence, it means that the indicator responds to changes in market volatility, which is the degree of variation in a trading price series over time.
The Nadaraya Watson Envelope uses a mathematical model to smooth out price fluctuations and highlight the underlying trend. This smoothing process helps to filter out ‘noise’ or random price movements that may not be indicative of the overall market trend. This can be particularly useful in volatile markets, where price movements can be erratic and unpredictable.
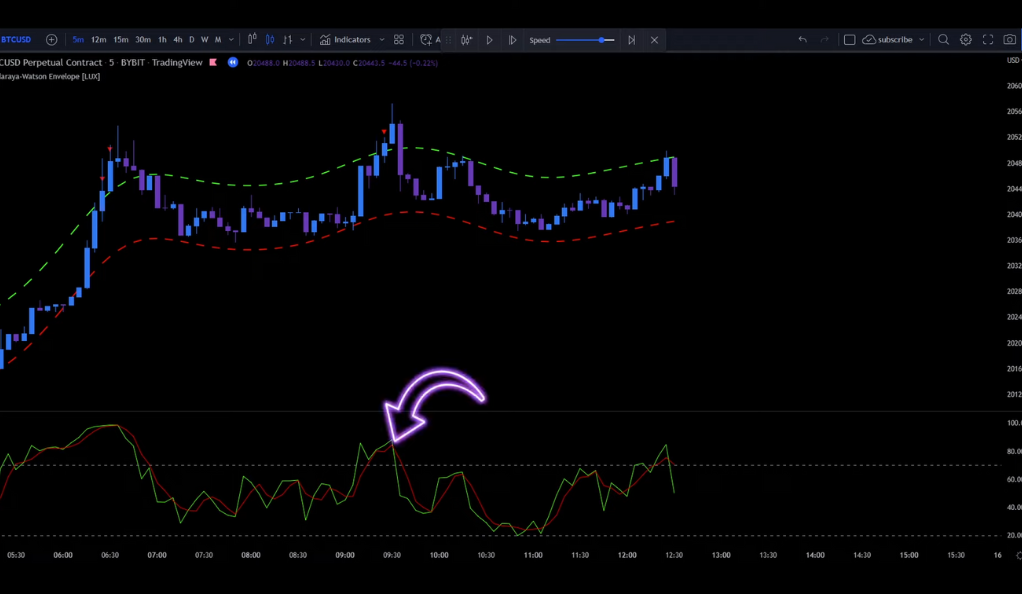
The indicator consists of an envelope that wraps around the price action. When prices touch the upper band of the envelope, it could indicate a potential overbought condition, suggesting a possible market reversal to the downside. Conversely, when prices touch the lower band, it could signal a potential oversold condition, indicating a possible market reversal to the upside.
The Relative Strength Index (RSI): A Momentum Oscillator
On the other hand, the Relative Strength Index (RSI) is a momentum oscillator that measures the speed and change of price movements. Momentum oscillators are graphical representations that oscillate around a centerline or between set levels, providing insights into the strength or weakness of a market trend.
The RSI helps traders identify overbought or oversold conditions in the market, providing insights into potential reversal points. An overbought condition is typically seen as a signal that the market may be due for a correction to the downside, while an oversold condition could suggest a potential upward correction.
The RSI is calculated using the average gains and losses over a specified period, typically 14 periods. The RSI value can range from 0 to 100. Generally, an RSI value over 70 indicates an overbought condition, while an RSI value under 30 signals an oversold condition.
The Nadaraya Watson Envelope and RSI: What Are They?
The Nadaraya Watson Envelope by Lux Algo is a volatility-based indicator that helps traders identify market trends and potential reversals. It uses a mathematical model to smooth out price fluctuations and highlight the underlying trend.
On the other hand, the Relative Strength Index (RSI) is a momentum oscillator that measures the speed and change of price movements. It helps traders identify overbought or oversold conditions in the market, providing insights into potential reversal points.
Setting Up the Indicators for the 5-Minute Scalping Strategy
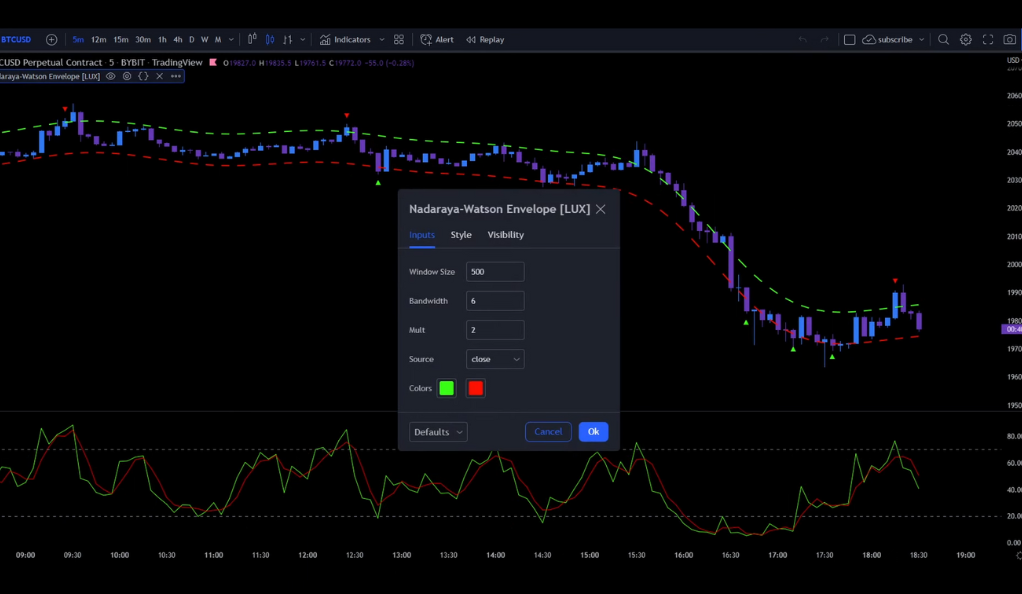
To effectively implement this strategy, we first need to set up our indicators correctly. For the Nadaraya Watson Envelope, we adjust the bandwidth to 6 and the multiplier to 2. These settings help the indicator adapt to the rapid price movements in a 5-minute timeframe.
For the RSI, we set the RSI length to 5 and the MA length to 3. This makes the RSI more responsive to recent price changes, which is crucial for a scalping strategy that relies on quick trades.
Identifying Entry Points: The Key to Successful Scalping
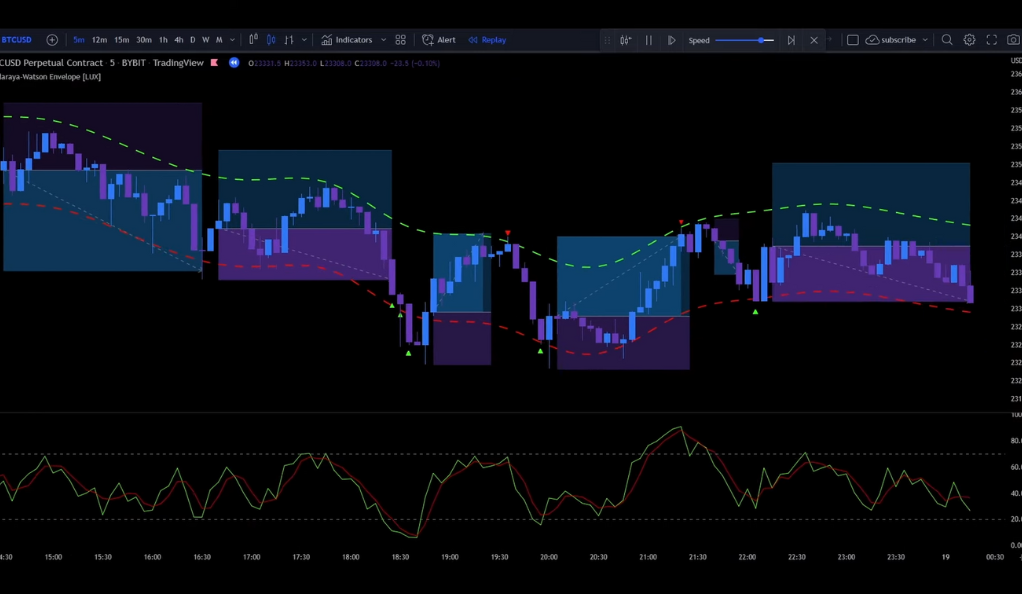
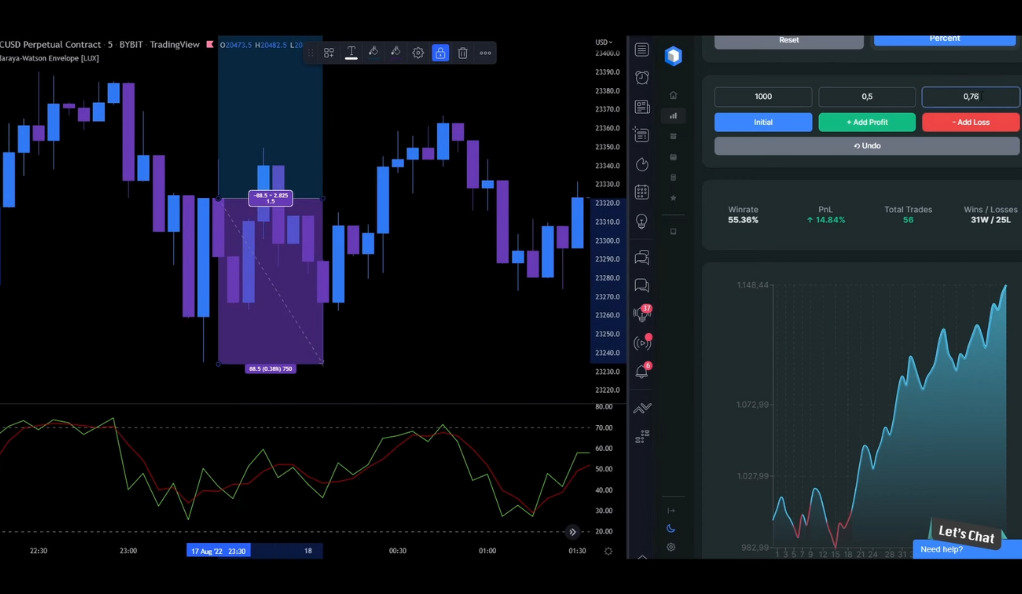
With our indicators set up, the next step is to identify potential entry points for our trades. For a short entry, we wait for a candle to touch the green band of the Nadaraya Watson Envelope. This suggests that the market may be overbought, and a downward price correction could be imminent. However, to confirm this, we need the RSI lines to cross with the red line above the green line. This indicates that the market’s momentum is shifting towards the sellers.
For a long entry, the process is reversed. We wait for a candle to touch the red band, indicating a potential oversold condition. We then look for the RSI lines to cross with the red line below the green line, suggesting that the buyers are gaining momentum.
Risk Management: Setting Up Stop Loss and Risk to Reward Ratio
Risk management is a critical aspect of any trading strategy. For the 5-minute scalping strategy, we set our stop loss at the last swing high for short entries and at the last swing low for long entries. This helps limit potential losses if the market moves against our trade.
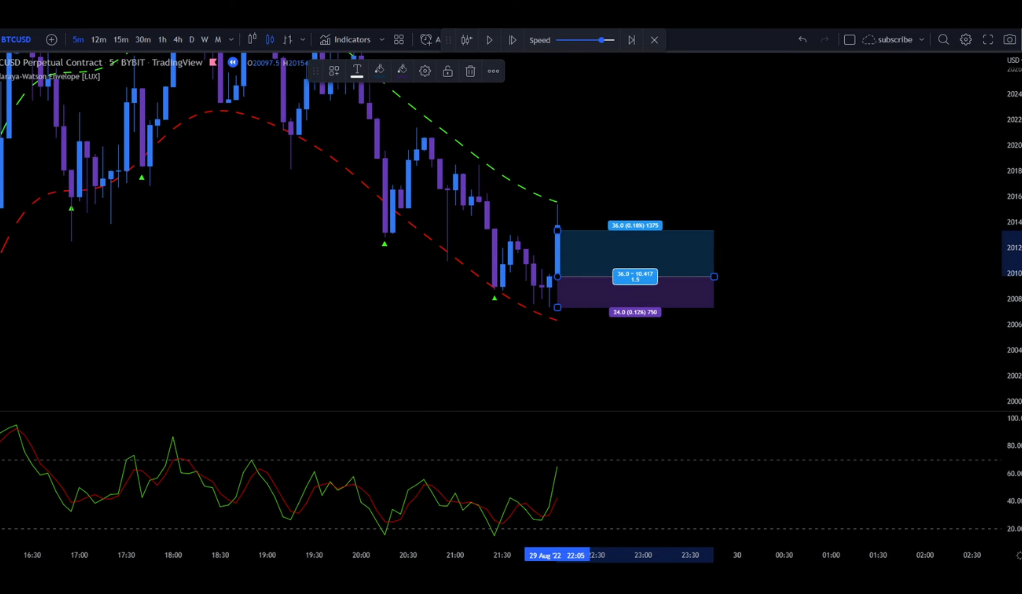
The risk to reward ratio is set at 1 to 1.5. This means that for every unit of risk we take (as defined by our stop loss), we aim to gain 1.5 units in profit. This ratio ensures that our potential profits outweigh our potential losses over many trades, even if we don’t win every trade.
Backtesting the Strategy: A Reality Check
Backtesting is a crucial step in validating the effectiveness of a trading strategy. It involves applying the strategy to historical market data to see how it would have performed. In our case, we started with an initial balance of 1000 USD and risked 2% per trade. The backtesting results showed a win rate of 49% and a profit and loss (PnL) of 11%.
Interpreting the Backtesting Results
The backtesting results provide valuable insights into the strategy’s performance. The account grew from 1000 USD to 1100 USD, indicating a profit. However, the win rate of 49% suggests that the strategy is not always successful. The largest profit trade was 1.96%, while the largest loss trade was 3.08%. This highlights the importance of risk management in trading, as a few large losses can quickly erase many small wins.
The Pros and Cons of the 5-Minute Scalping Strategy
Like any trading strategy, the 5-minute scalping strategy has its strengths and weaknesses. On the positive side, it allows for quick profits in a short time frame, making it ideal for day traders. It also provides clear entry and exit points, making it relatively easy to implement.
However, the strategy also has its drawbacks. It has a relatively low win rate, meaning that traders must be prepared to deal with frequent losses. It also requires constant monitoring of the market, which can be mentally exhausting. Finally, it relies heavily on the accuracy of the indicators, which may not always provide reliable signals.
Conclusion
In conclusion, the 5-minute scalping strategy, based on the Nadaraya Watson Envelope and RSI, offers a systematic approach to rapid trading. However, like all trading strategies, it requires careful risk management and a thorough understanding of the market. It’s not a foolproof method to quick riches but a tool that, when used correctly, can provide opportunities for profit in the fast-paced world of cryptocurrency trading. As always, it’s crucial to do your research and backtest any strategy before implementing it in live trading. Remember, in trading, knowledge is power. Happy trading!
Ainu Token aims to offer impartial and trustworthy information on cryptocurrency, finance, trading, and shares. However, we don't provide financial advice and recommend users to conduct their own studies and thorough checks.
Comments (No)