Having a reliable and effective trading strategy is crucial in the fast-paced world of cryptocurrency trading. One popular strategy involves using the Donchian Zig-Zag Indicator developed by Lux Algo. This indicator helps traders identify significant price movements and potential trend reversals by drawing trend lines that connect the highest highs and lowest lows within a specified period. When applied to the Bitcoin chart with a 1-hour timeframe, it provides valuable insights into market dynamics and assists in making informed trading decisions.
The Donchian Zig-Zag Indicator on the Bitcoin chart helps traders identify support and resistance levels by connecting the highest highs and lowest lows over a specified period, such as the previous 20 candles. It also signals potential trend reversals, with a break above the highest high indicating a bullish trend and a break below the lowest low suggesting a bearish trend. By using this indicator, traders can make more informed decisions, but it’s important to remember that no indicator guarantees accuracy, so additional tools and techniques should be used for confirmation.
Understanding the Donchian Zig-Zag Indicator
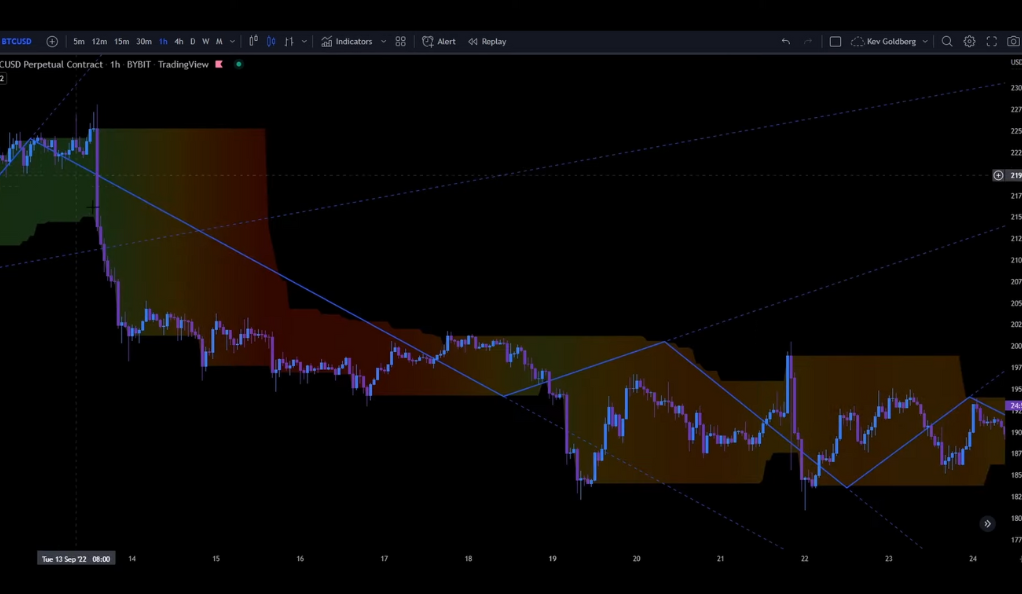
The Donchian Zig-Zag Indicator is a valuable tool for traders seeking to understand market trends and reversals. It operates by analyzing price movements over a given period to identify significant highs and lows in the market. The indicator draws trend lines that connect the highest highs and lowest lows, creating a visual representation of the price action. By focusing on these trend lines, traders can identify key support and resistance levels, which can guide their trading decisions.
The indicator is particularly useful in highlighting potential trend reversals. When the price breaks above the highest high trend line, it suggests a bullish trend may be forming, indicating a potential buying opportunity. Conversely, when the price breaches below the lowest low trend line, it signals a bearish trend and a possible selling opportunity. By monitoring these trend lines and recognizing the shifts in market direction, traders can make more informed decisions and potentially improve their trading outcomes. However, it’s important to note that while the Donchian Zig-Zag Indicator provides valuable insights, traders should use it in conjunction with other tools and analysis techniques to validate their trading strategies.
The Mechanics of the Donchian Zig-Zag Indicator
The Donchian Zig-Zag Indicator operates by creating a line that moves upward when the price reaches a new high and downward when the price hits a new low. This zig-zag pattern provides traders with a visual representation of the market’s direction and volatility. By observing the lines, traders can gain insights into the overall trend and potential price reversals. However, it’s essential to note that the effectiveness of the indicator relies on the interpretation and analysis skills of the trader. It is important to use the Donchian Zig-Zag Indicator in conjunction with other indicators and tools to validate trading decisions and avoid relying solely on its signals.
Similar to a compass in the wilderness, the Donchian Zig-Zag Indicator is a tool that can guide traders in understanding market movements. However, it should be used alongside other technical analysis tools and fundamental research to enhance trading decisions. Traders must interpret the indicator’s signals in the context of the overall market conditions and consider other factors such as volume, price patterns, and market news to make well-informed trading choices. Ultimately, the success of utilizing the Donchian Zig-Zag Indicator depends on the trader’s ability to effectively analyze and interpret its signals within the broader context of the market.
Applying the Indicator to Bitcoin Trading
When the Donchian Zig-Zag Indicator is applied to the Bitcoin chart with a 1-hour timeframe, it provides traders with a detailed perspective on the market’s movements. Just like observing the ebb and flow of ocean tides, each wave captured by the indicator offers valuable insights into the underlying currents of the Bitcoin market.
By closely monitoring the zig-zag pattern formed by the indicator, traders can identify key support and resistance levels, as well as potential trend reversals. The indicator helps to visualize the price action in a more granular manner, allowing traders to make informed decisions based on the observed waves and patterns. However, it is important to remember that the indicator should not be used in isolation but in combination with other analysis techniques to validate trading strategies and consider additional market factors.
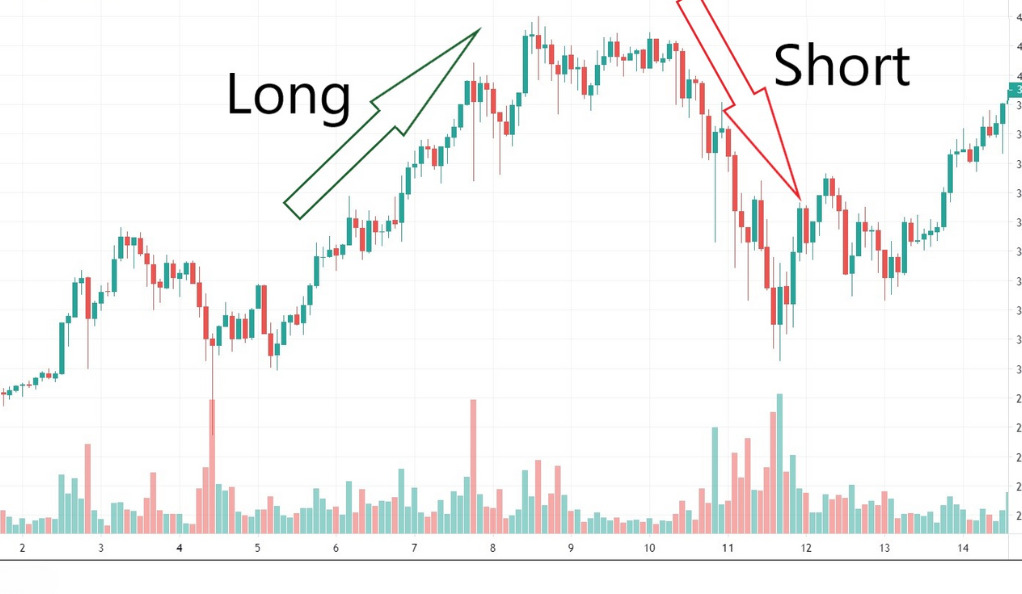
Trading Rules for Long and Short Trades
The trading rules for long and short trades using the Donchian Zig-Zag Indicator are relatively simple to follow. When looking to enter a long trade, traders wait for the indicator’s line to turn upwards after a downward movement. This suggests a potential bullish trend reversal, indicating a favorable time to enter a trade and ride the upward momentum. On the other hand, for short trades, traders enter when the indicator’s line turns downwards after an upward movement. This indicates a potential bearish trend reversal, presenting an opportunity to profit from a downward price movement.
Effectively using the Donchian Zig-Zag Indicator is akin to timing the swings of a pendulum. Traders aim to enter a trade at the right moment, aligning with the indicator’s signal, and exit when they believe they have maximized their gains or achieved their desired profit target. By following these trading rules, traders can leverage the insights provided by the indicator to identify potential trend reversals and capitalize on the market’s price swings. However, it is important to exercise caution and use additional analysis techniques and risk management strategies to validate and safeguard trading decisions.
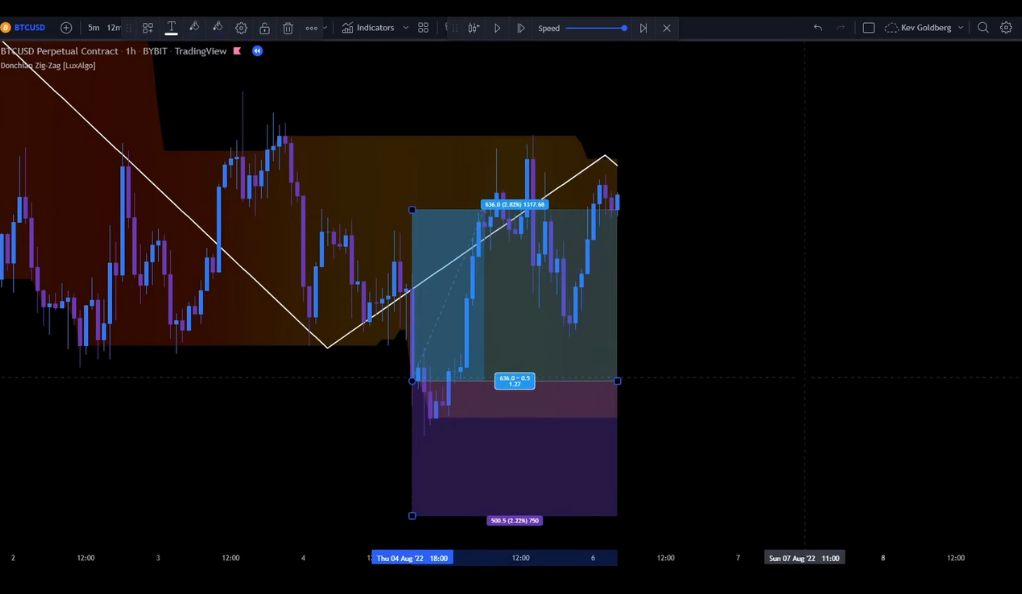
Practical Examples of Using the Indicator
To illustrate the practical application of the trading rules using the Donchian Zig-Zag Indicator, let’s consider a few examples. Suppose you’re analyzing the Bitcoin chart and notice the indicator’s line turning upwards after a significant downward movement. This serves as a signal to enter a long trade, as it suggests a potential trend reversal and the start of a bullish movement. In this scenario, you could consider opening a long position, aiming to profit from the anticipated upward price movement.
Conversely, if you observe the indicator’s line turning downwards following a notable upward movement, it indicates a potential trend reversal and a signal to enter a short trade. In such a situation, you may opt to open a short position, anticipating a bearish price movement and seeking to capitalize on the downward trend.
Applying the Donchian Zig-Zag Indicator in practical trading scenarios is akin to playing a game of chess. Each move is calculated and strategic, based on the signals provided by the indicator. Traders evaluate the market conditions, observe the indicator’s line movements, and make decisions accordingly. However, it is crucial to complement the indicator with other analysis tools and risk management strategies to increase the likelihood of successful trades.
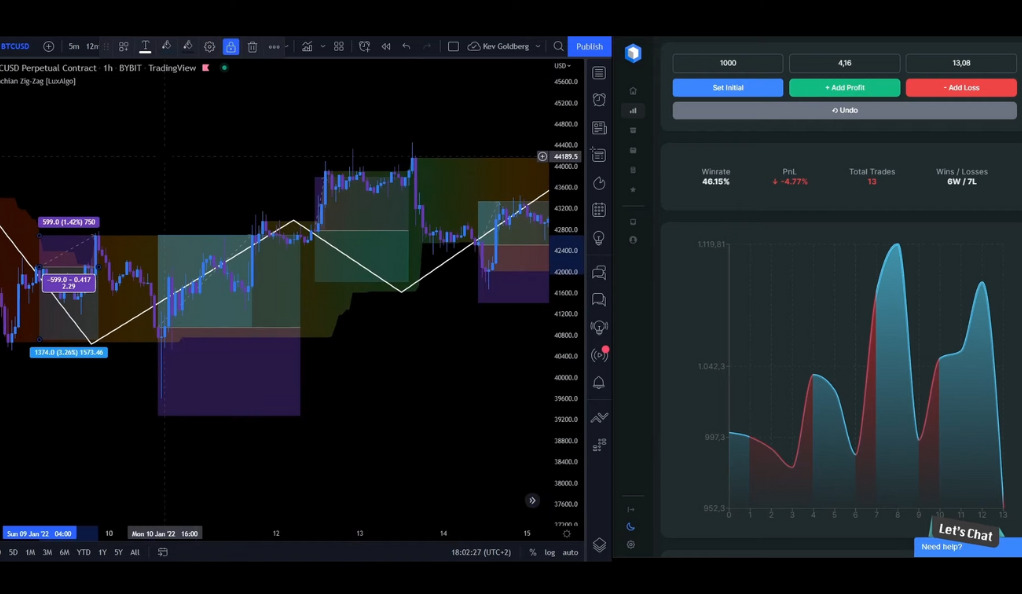
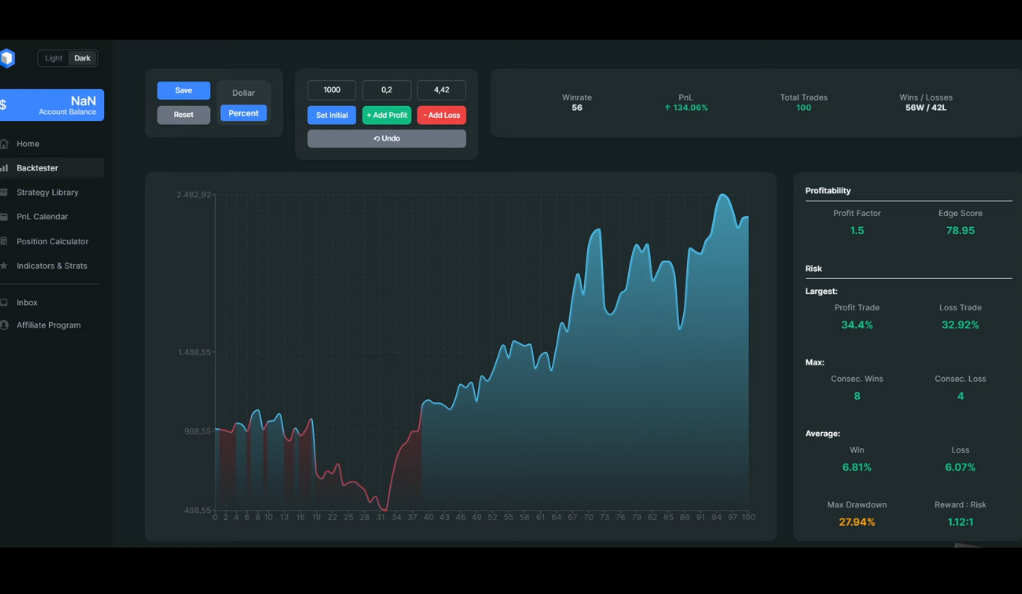
Backtesting the Indicator: The Results
Backtesting serves as a crucial process for assessing the efficacy of a trading strategy, including the application of the Donchian Zig-Zag Indicator. The backtesting results of this indicator have been notable, with a win rate of 56%. This means that, based on historical data, the indicator accurately identified profitable trading opportunities in 56% of the cases tested. While not perfect, this win rate demonstrates that the indicator has performed above average and holds potential for traders seeking to incorporate it into their strategies.
To put it into perspective, a win rate of 56% can be likened to a baseball player with a batting average of .560. Although not achieving a perfect score, such a batting average is considered highly commendable and demonstrates skill and consistency. Similarly, the Donchian Zig-Zag Indicator’s win rate provides evidence of its effectiveness in identifying favorable trading opportunities. However, it’s important to note that backtesting results are based on historical data and should be complemented with real-time analysis and adaptation to current market conditions. Traders should continue to monitor and refine their strategies while considering other factors like risk management and portfolio diversification to achieve long-term success.
Profit and Loss from the Backtesting
The backtesting results of the Donchian Zig-Zag Indicator also revealed a remarkable Profit and Loss (PnL) figure, amounting to a 134% return. This means that for every dollar invested and risked based on the indicator’s signals, the strategy yielded a profit of $1.34. This PnL figure demonstrates the potential profitability of incorporating the indicator into a trading strategy.
Analogously, achieving a PnL of 134% can be likened to investing in a business venture that returns $134 for every $100 invested. Such a profitable return on investment indicates the effectiveness of the Donchian Zig-Zag Indicator in identifying favorable trading opportunities and generating positive returns. However, it’s important to exercise caution and remember that past performance does not guarantee future results. Traders should continuously evaluate and adapt their strategies while managing risk to achieve consistent profitability in the dynamic cryptocurrency market.
Conclusion
In conclusion, the Donchian Zig-Zag Indicator by Lux Algo offers a robust and effective strategy for trading Bitcoin on a 1-hour timeframe. With clear trading rules and impressive backtesting results, it’s a tool worth considering for any serious cryptocurrency trader. Remember, in the volatile world of cryptocurrency trading, having a reliable strategy is like having a sturdy ship in a storm – it might not prevent the storm, but it can certainly help you navigate through it.
Ainu Token aims to offer impartial and trustworthy information on cryptocurrency, finance, trading, and shares. However, we don't provide financial advice and recommend users to conduct their own studies and thorough checks.