The Keltner Channel and Ichimoku plus Keltner Channels are widely used indicators in trading. They offer valuable insights into market trends and potential trading opportunities. Traders often employ backtesting, a technique that applies these indicators to historical market data, to evaluate their effectiveness.
Backtesting allows traders to simulate their trading strategies and assess how these indicators would have performed in the past. By analyzing historical data, traders can gain insights into the strengths and weaknesses of the Keltner Channel and Ichimoku plus Keltner Channels. However, it’s important to note that backtesting results are based on historical data and do not guarantee future performance. Market conditions can change, and unforeseen events can impact trading outcomes. Therefore, while backtesting can provide useful insights, traders should complement it with real-time analysis and adapt their strategies to current market conditions to enhance their trading success.
What is Backtesting?
Backtesting is a valuable tool used by traders to assess the performance of a trading strategy or indicator. It involves applying the strategy or indicator to historical market data to evaluate how it would have performed in the past. By simulating trades based on historical data, traders can gain insights into the profitability and effectiveness of their strategy.
During backtesting, traders typically use historical price data to generate buy and sell signals according to their chosen strategy or indicator. They then track the hypothetical trades and measure the profitability, drawdowns, and other performance metrics. This allows traders to assess the potential risks and rewards associated with their strategy and make informed decisions about whether to implement it in real-time trading.
However, it’s important to note that backtesting has limitations. Historical data cannot perfectly replicate future market conditions, and there may be discrepancies between backtesting results and actual trading outcomes. Traders should use backtesting as a complementary tool alongside real-time analysis and exercise caution when interpreting the results. It is advisable to continually monitor and refine trading strategies based on current market conditions to improve the chances of success.
The Ichimoku Plus Keltner Channels Indicator
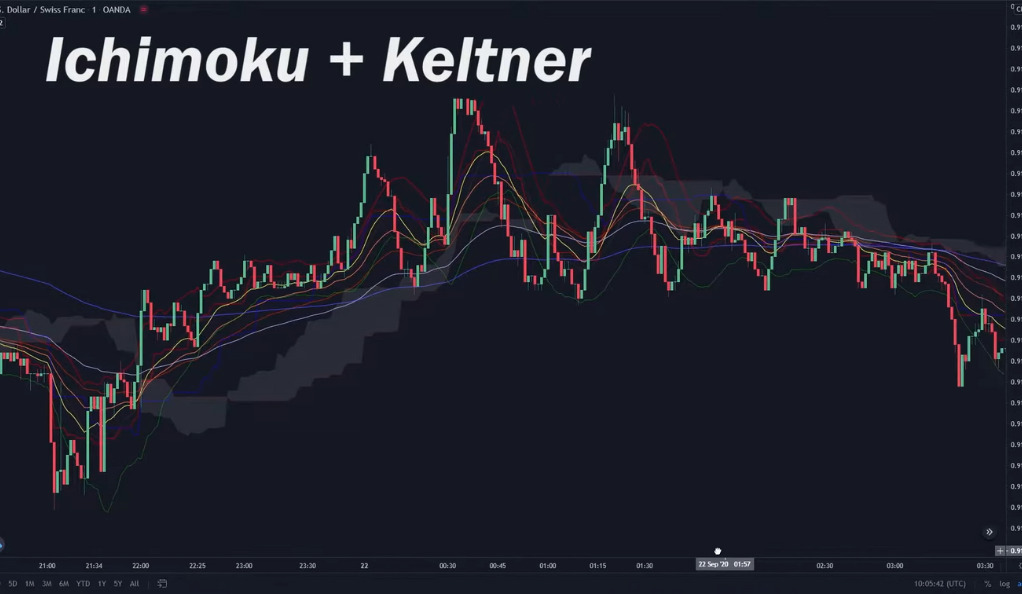
The Ichimoku plus Keltner Channels indicator is a powerful combination of two popular trading indicators. This hybrid indicator combines the insights of the Ichimoku Cloud and the Keltner Channels to offer traders a comprehensive view of market trends, support and resistance levels, and potential trading opportunities. By combining these indicators, traders can obtain a holistic snapshot of the market dynamics and make more informed trading decisions.
When put to the test, the Ichimoku plus Keltner Channels indicator has shown promising results. Traders have reported success in identifying trend reversals, determining optimal entry and exit points, and managing risk effectively. However, it is important to note that the effectiveness of the indicator can vary depending on market conditions and individual trading strategies. Traders are advised to thoroughly backtest the indicator on historical data and consider its performance in different market scenarios before incorporating it into their trading approach. Additionally, combining the indicator with other technical analysis tools and practicing sound risk management techniques can further enhance its effectiveness in real-time trading.
Backtesting the Ichimoku Plus Keltner Channels
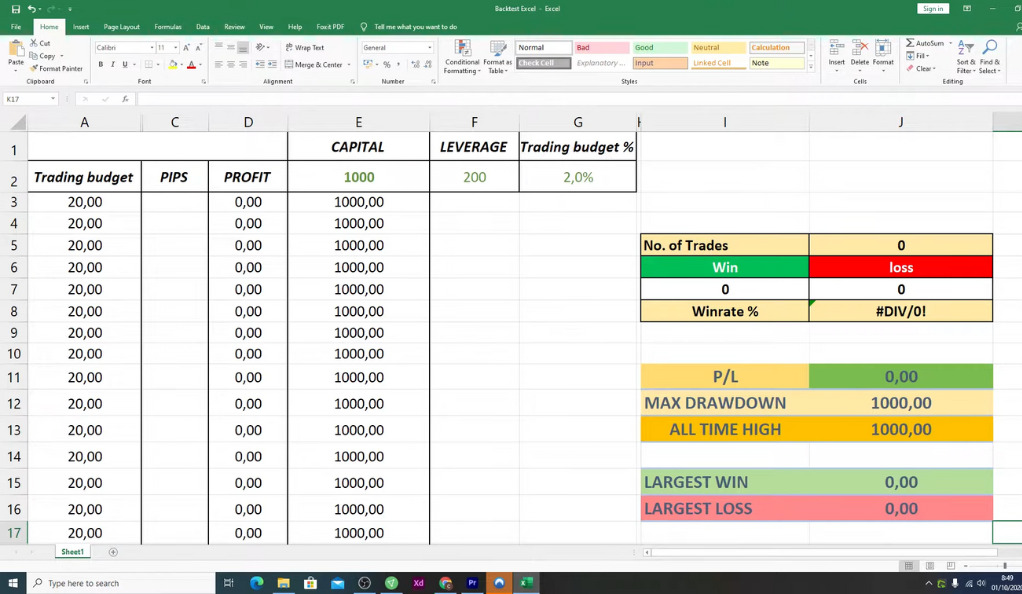
A backtest was conducted on the Ichimoku plus Keltner Channels indicator using three different currency pairs: the US dollar/Swiss franc, the pound/yen, and the Australian dollar/New Zealand dollar. The backtest was performed on a 30-minute timeframe, starting with a capital of $1,000 and utilizing 200 times leverage per trade. Risk management was implemented, with only 2% of the total capital being risked per trade.
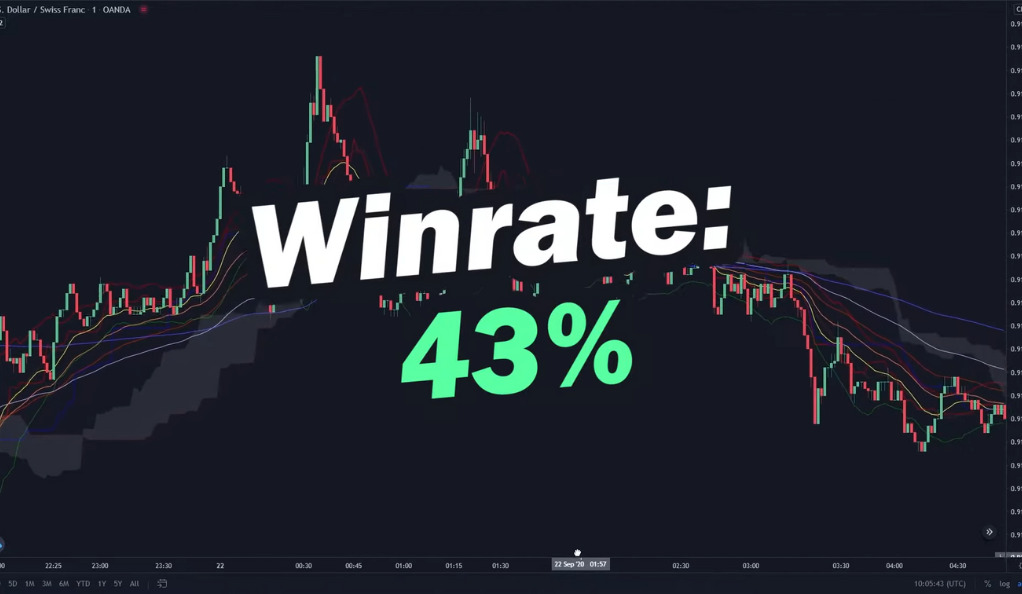
After conducting 100 backtests, it was found that the win rate of the Ichimoku plus Keltner Channels strategy was 43%. However, it is important to note that this strategy took a considerable amount of time to reach 100 trades, specifically 20 months. The final outcome of the backtest resulted in a loss of $1.61 after 20 months and 100 trades.
These results indicate that the Ichimoku plus Keltner Channels strategy, as implemented in this backtest, did not yield profitable results. However, it’s crucial to remember that backtesting results are based on historical data and may not accurately reflect future performance. Traders should consider these findings as a starting point and further refine their strategy by analyzing additional market data, employing risk management techniques, and adapting their approach to current market conditions.
The Classic Keltner Channel Indicator
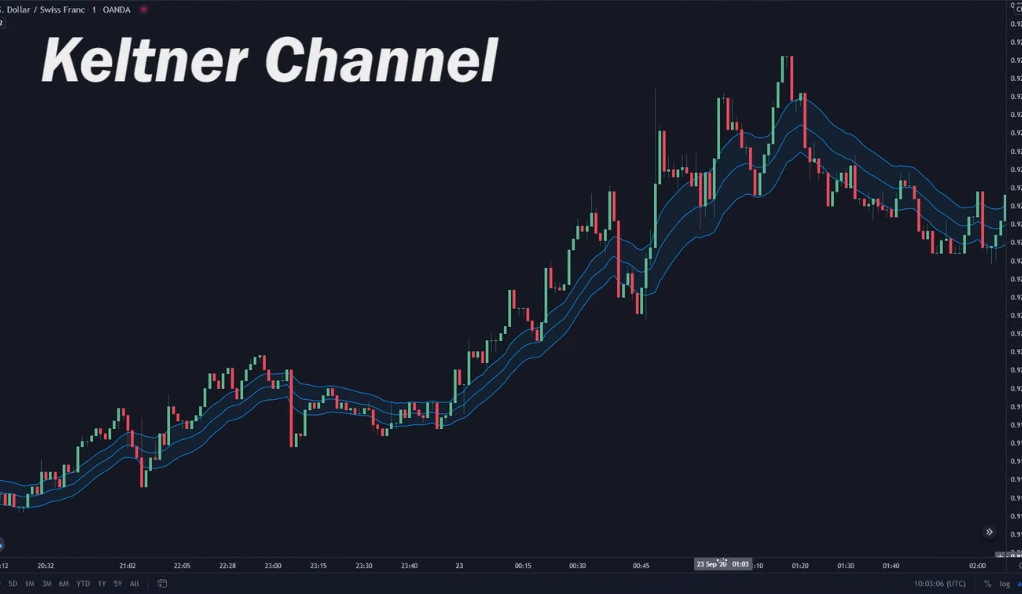
The Classic Keltner Channel is a popular volatility-based indicator that offers traders a visual representation of price movements. It consists of an upper band, a middle line (usually a simple moving average), and a lower band. The upper and lower bands are typically set at a certain number of average true range (ATR) units above and below the middle line, respectively. This indicator helps identify periods of high or low volatility and can assist traders in spotting potential trading opportunities.
When backtested, the Classic Keltner Channel has shown promising results. Traders have reported success in using it to identify breakouts, confirm trend reversals, and determine optimal entry and exit points. By incorporating the Classic Keltner Channel into their trading strategies, traders have been able to adapt to changing market conditions and make more informed trading decisions. However, it’s important to note that backtesting results are based on historical data and do not guarantee future performance. Traders should complement backtesting with real-time analysis and continuously monitor market conditions to enhance the effectiveness of the Classic Keltner Channel in their trading approach.
Backtesting the Keltner Channel
The Keltner Channel was subjected to a backtest using the price breakout technique on the 30-minute chart of the USD/Swiss franc currency pair. The backtest utilized the same parameters as the previous test, including the starting capital, leverage, and risk management parameters.
After conducting 100 backtests, it was found that the win rate of the Keltner Channel strategy was only 31%. The backtest reached 100 trades within a span of four months, which is a relatively shorter timeframe compared to the previous test. However, despite the shorter timeframe, the strategy resulted in a loss of $57. These results indicate that the Keltner Channel strategy, as implemented in this backtest, did not yield profitable results.
It is important to remember that backtesting results are based on historical data and may not accurately reflect future performance. Traders should consider these findings as a starting point and further refine their strategy by analyzing additional market data, adjusting parameters, and adapting their approach to current market conditions. Risk management techniques and real-time analysis should also be employed to improve the potential profitability of the Keltner Channel strategy.
The Pros and Cons of These Indicators
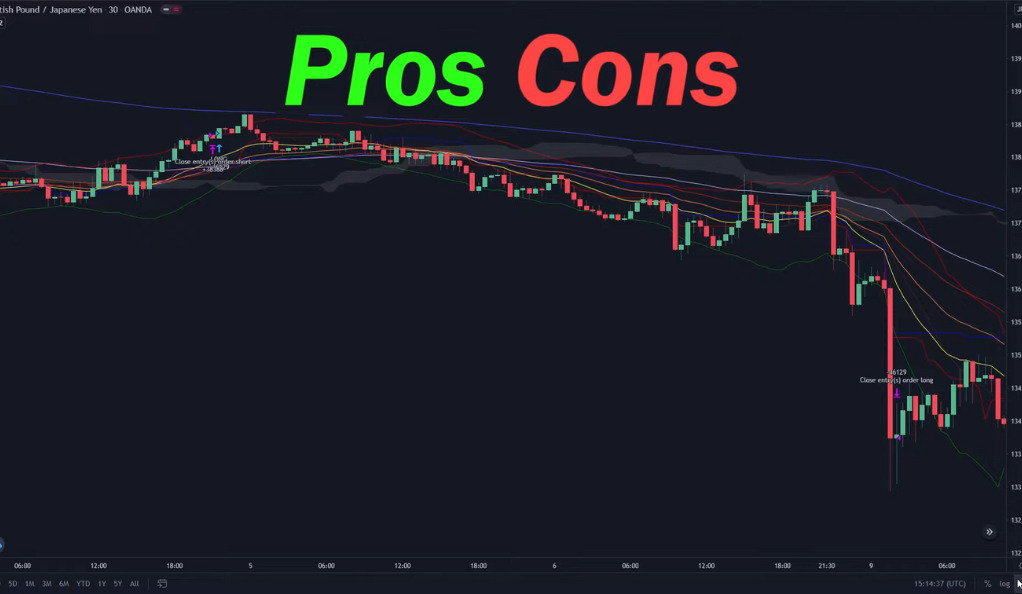
Both the Ichimoku plus Keltner Channels and the Keltner Channel indicators offer advantages and disadvantages to traders. The Ichimoku plus Keltner Channels indicator has the potential to deliver substantial gains due to the longer duration of trades it generates. This can be advantageous for traders who prefer holding positions for a significant period. However, it’s important to note that this extended trade duration can also expose traders to larger potential losses if the market moves against their positions. It requires careful risk management to mitigate the downside risk associated with longer trades.
The Keltner Channel is known for providing clear signals for price breakouts, aiding traders in identifying entry and exit points in trending markets. Its adaptability to changing market conditions and volatility levels is advantageous. However, the Keltner Channel is prone to false signals, which can result in losses if traders act on them without confirmation from other indicators. Traders should consider their trading style, risk tolerance, and strategy when choosing an indicator and utilize risk management techniques and additional tools to enhance their trading decisions.
The Importance of Strategy
The results of the backtests emphasize the significance of having a well-defined strategy in trading. While the Keltner Channel and the Ichimoku plus Keltner Channels are valuable tools, their effectiveness ultimately hinges on the strategy employed by traders. It is important to recognize that no indicator guarantees success on its own. Traders must conduct thorough backtesting, experimenting with various strategies, and identifying the approach that aligns with their trading goals and risk tolerance.
By backtesting different strategies, traders can gain insights into the strengths and weaknesses of each approach when combined with the Keltner Channel or the Ichimoku plus Keltner Channels. This process enables traders to refine their strategies, optimize their trading decisions, and increase the probability of success. It is crucial to continually adapt and evolve the strategy based on changing market conditions, as well as to practice effective risk management. A well-crafted strategy, combined with diligent analysis and risk management, forms the foundation for successful trading with these indicators.
Conclusion
In the world of trading, there’s no one-size-fits-all solution. What works for one trader might not work for another. Therefore, it’s essential to understand the tools at your disposal, backtest various strategies, and find the one that suits your trading style and risk tolerance. Remember, the key to successful trading lies not in the tools you use, but in how you use them.
Ainu Token aims to offer impartial and trustworthy information on cryptocurrency, finance, trading, and shares. However, we don't provide financial advice and recommend users to conduct their own studies and thorough checks.
Comments (No)