In the world of trading, technical analysis is an essential tool for making informed decisions about buying and selling assets. It involves studying price charts and using various technical indicators to identify trends, support and resistance levels, and other patterns that can help traders make profitable trades.
One important aspect of technical analysis is the use of trading indicators. These indicators are mathematical calculations based on the price and volume data of a given asset, which help traders to identify patterns and trends that may not be visible to the naked eye. Trading indicators can be used to confirm trends, identify potential reversals, and generate buy or sell signals.
The table below is an example of MACD. You can change the stock symbol (it also works with cryptocurrencies and ETFs).
Two popular trading indicators that traders often use are MACD and Impulse MACD. MACD, or Moving Average Convergence Divergence, is a popular indicator that was developed in the 1970s. It is a versatile indicator that can be used to identify trends, momentum, and potential reversals.
Impulse MACD, on the other hand, is a newer indicator that was developed by the team at Technical Traders Ltd. It is based on the original MACD indicator, but includes additional features that make it more sensitive to price changes and more accurate in its signals.
The purpose of this article is to introduce traders to Impulse MACD and explain why it may be a better choice than the traditional MACD indicator. We will compare the two indicators and show why Impulse MACD can be a more reliable tool for making profitable trades.
Contents
Understanding MACD
Moving Average Convergence Divergence, or MACD, is a popular technical analysis indicator used by traders to identify potential buy or sell signals in the markets. In this section, we will discuss what MACD is, how it’s calculated, its three components, how it is used in trading, and its limitations.
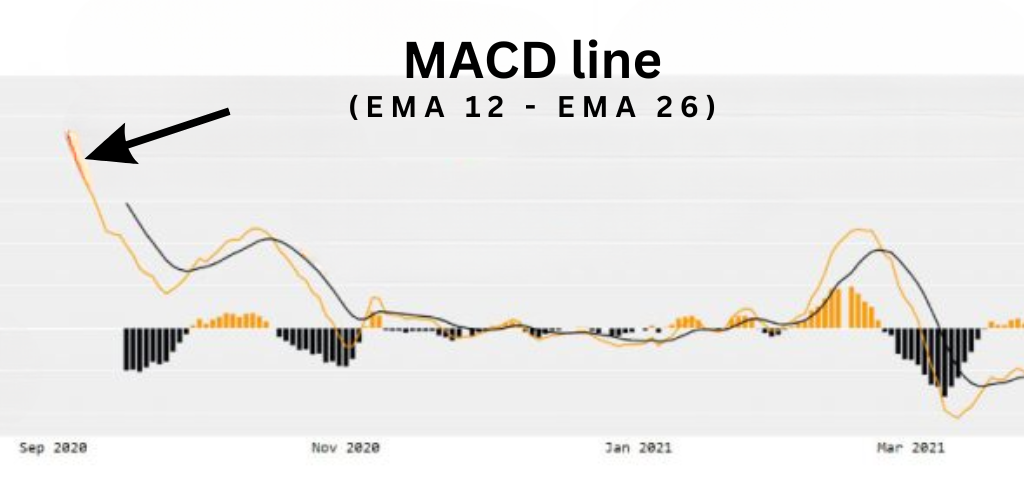
MACD is calculated by subtracting the 26-period exponential moving average (EMA) from the 12-period EMA. The result is plotted on a chart as a line that oscillates around the zero line. The three components of MACD are the MACD line, signal line, and histogram.
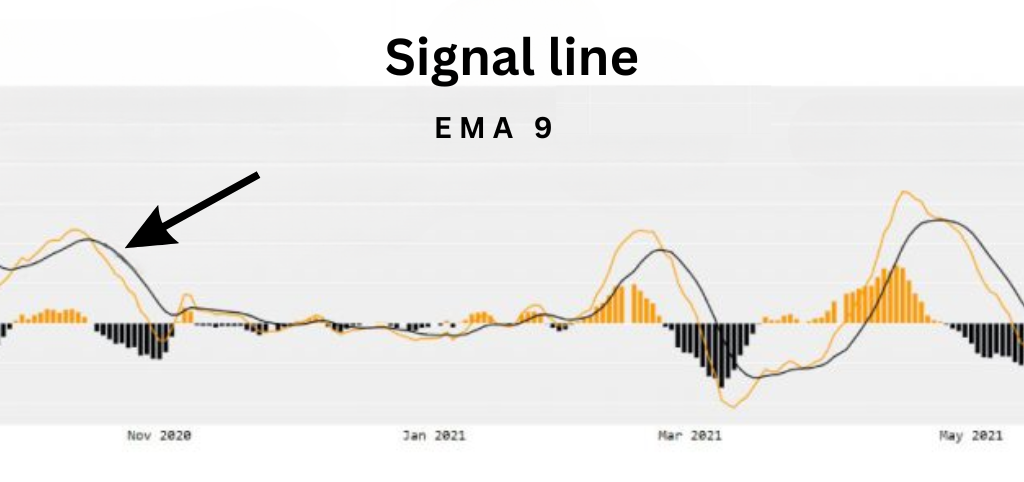
The MACD line is the difference between the 12-period and 26-period EMAs. The signal line is a 9-period EMA of the MACD line. The histogram is the difference between the MACD line and the signal line, plotted as a series of bars that oscillate around the zero line.
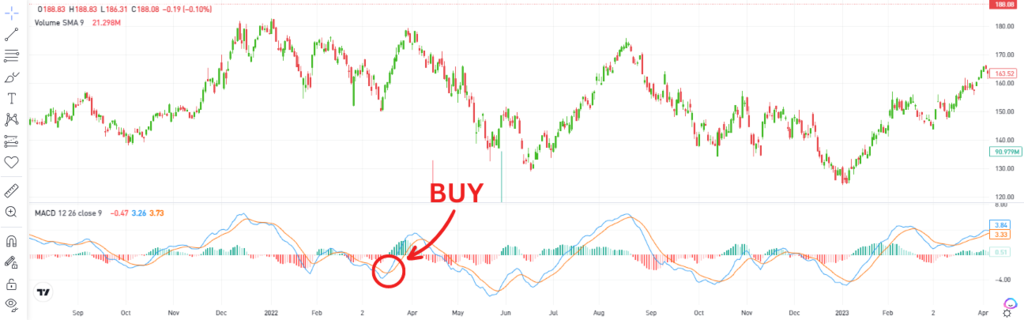
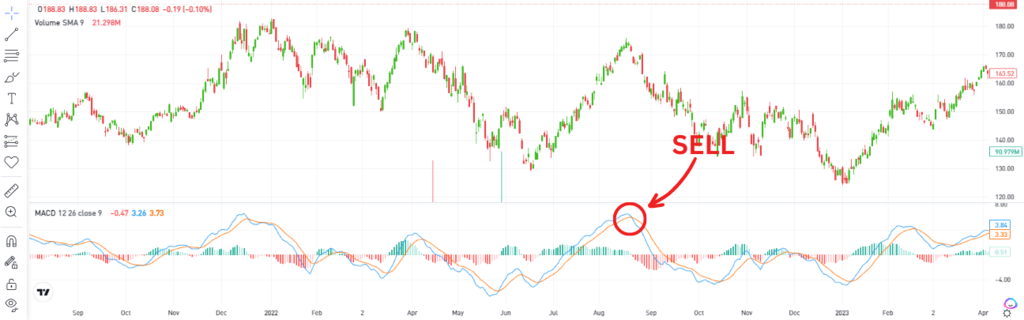
MACD is used in trading to identify potential buy or sell signals. When the MACD line crosses above the signal line, it is considered a bullish signal and traders may look to buy the asset. When the MACD line crosses below the signal line, it is considered a bearish signal and traders may look to sell the asset. The histogram can also be used to confirm the strength of the trend.
However, there are limitations to using MACD. It is a lagging indicator, meaning it may not be able to identify potential trend changes in real-time. Additionally, MACD signals can produce false positives or false negatives, leading to potential losses.
Let’s take a look at some examples of MACD signals in different market scenarios. In an uptrend, a bullish crossover occurs when the MACD line crosses above the signal line, indicating a potential buy signal. In a downtrend, a bearish crossover occurs when the MACD line crosses below the signal line, indicating a potential sell signal. The histogram can also confirm the strength of the trend.
Introducing Impulse MACD
Impulse MACD is a trading indicator that is gaining popularity among traders as an alternative to the traditional MACD. In this section, we will define Impulse MACD, explain its components, discuss how it is different from MACD, its advantages, and provide examples of Impulse MACD signals in different market scenarios.
Impulse MACD is calculated by subtracting the 25-period exponential moving average (EMA) from the 13-period EMA. The result is plotted on a chart as a line that oscillates around the zero line. The three components of Impulse MACD are the impulse line, trigger line, and histogram.
The impulse line is the difference between the 13-period and 25-period EMAs. The trigger line is a 9-period EMA of the impulse line. The histogram is the difference between the impulse line and the trigger line, plotted as a series of bars that oscillate around the zero line.
Impulse MACD is different from MACD in that it is faster and more responsive to market changes. Its shorter time frame allows it to pick up on trend changes earlier than MACD, which is based on a longer time frame. Additionally, Impulse MACD provides a clearer picture of the trend direction, making it easier for traders to identify potential buy or sell signals.
The advantages of using Impulse MACD include its ability to pick up on trend changes earlier, its clearer trend direction, and its ability to filter out noise in the market. It also provides a more dynamic range of signals, allowing traders to adjust their trading strategies accordingly.
Let’s take a look at some examples of Impulse MACD signals in different market scenarios. In an uptrend, a bullish crossover occurs when the impulse line crosses above the trigger line, indicating a potential buy signal. In a downtrend, a bearish crossover occurs when the impulse line crosses below the trigger line, indicating a potential sell signal. The histogram can also be used to confirm the strength of the trend.
Impulse MACD on eToro
- Sign into your eToro Account or open a new account.
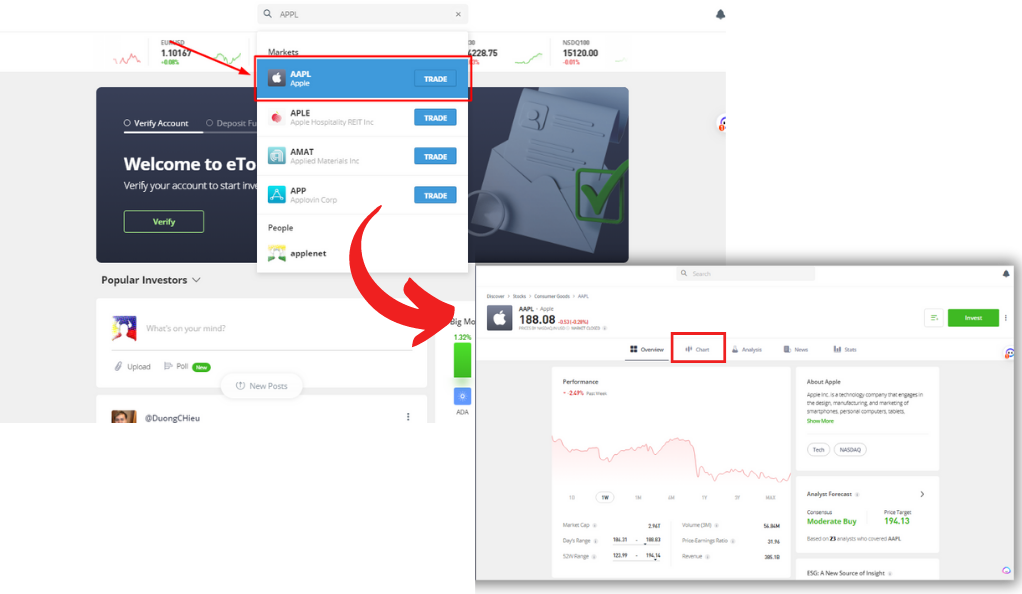
Open your preferred web browser and navigate to the eToro website. Use your credentials to log into your account.

- Launch the Asset’s Graph.
After you’ve successfully logged in, choose the asset you’re interested in examining. You can find this either by typing into the search bar or by browsing through the asset categories. Once you’ve located it, click on it to view its chart.
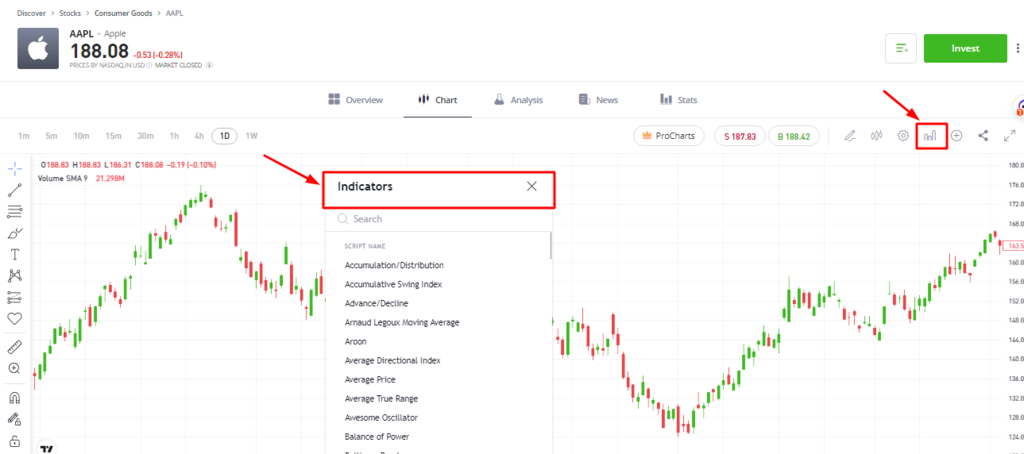
- Access the Indicators Menu.
Look for an option labeled “Indicators” in the chart interface, usually symbolized by an “f(x)” icon. Click on this to open the relevant dropdown menu.
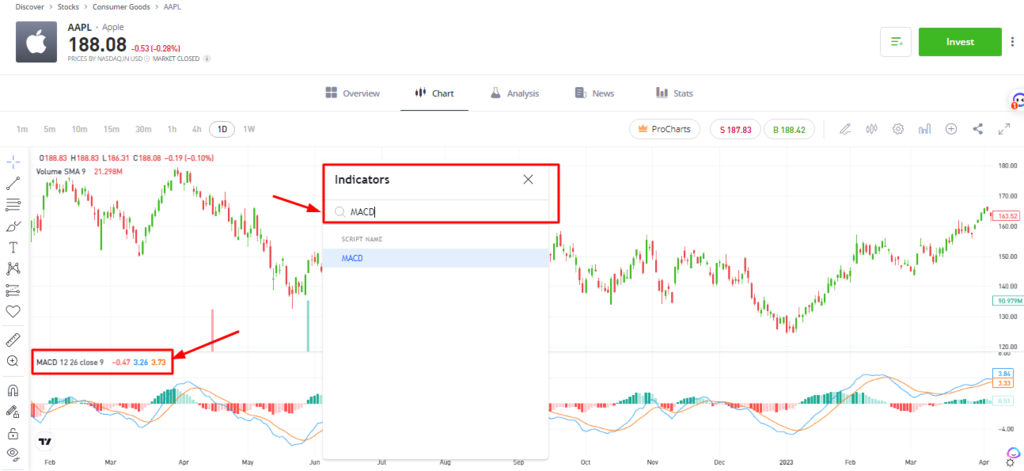
- Activate the MACD.
From the dropdown menu that appears, search for and select “MACD”. Upon selecting this, a MACD histogram will become visible beneath the asset’s price chart.
- Understand the MACD Components.
The MACD consists of two lines – the MACD line and the Signal line – that oscillate around a zero line. The MACD line is derived from the difference between the asset’s 26-day and 12-day moving averages of the closing price, while the Signal line is the asset’s 9-day exponential moving average.
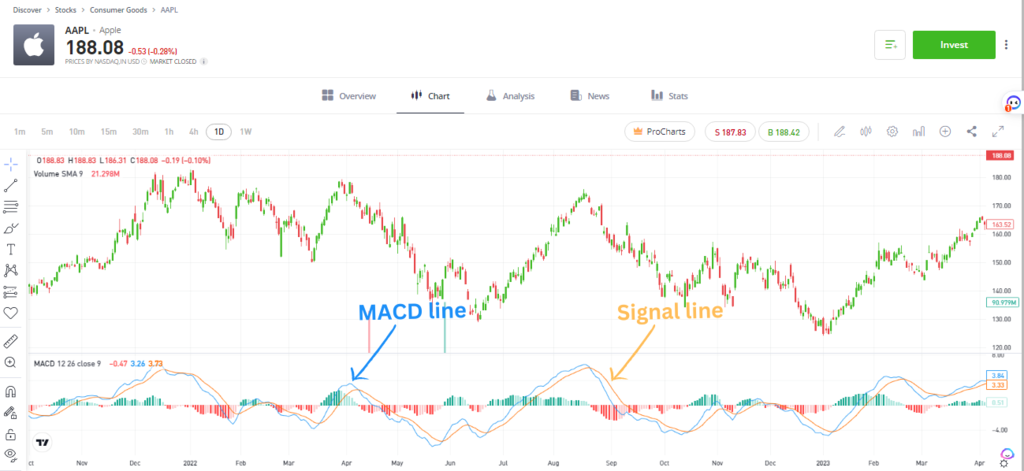
- Interpret the MACD Values.
If the MACD line crosses above the zero line, it could suggest that the price is gaining upward momentum, indicating a potential buying opportunity.
On the other hand, if the MACD line crosses below the zero line, it could signal a downward momentum, suggesting a potential selling opportunity.
How do I calculate Impulse MACD
The Impulse MACD (Moving Average Convergence Divergence) is a powerful technical indicator that helps traders identify and capitalize on market trends and momentum shifts by combining the principles of momentum and trend-following. To calculate the Impulse MACD, one must first determine two exponential moving averages (EMAs) with different time periods, typically a 12-day EMA and a 26-day EMA. The difference between these two EMAs is then calculated, resulting in the MACD line. Subsequently, a signal line is generated by calculating a 9-day EMA of the MACD line. The Impulse MACD is then derived by comparing the MACD line to its signal line. When the MACD line crosses above the signal line, it generates a bullish impulse, indicating that it may be an opportune time to buy or enter a long position. Conversely, when the MACD line crosses below the signal line, it signifies a bearish impulse, suggesting that it could be an appropriate moment to sell or enter a short position. By analyzing these crossovers, traders can gain valuable insights into potential market trends, enabling them to make informed decisions and capitalize on emerging opportunities.
Let’s dive into a step-by-step guide on how to calculate the Impulse MACD, complete with mathematical formulas.
Step 1: Choose the time periods for your EMAs Select two different time periods for your exponential moving averages (EMAs). The most common periods used are 12 days (short-term EMA) and 26 days (long-term EMA).
Step 2: Calculate the EMAs To calculate the EMAs, use the following formula: EMA = (Closing Price – Previous EMA) * (2 / (Time Period + 1)) + Previous EMA
Calculate the 12-day EMA and the 26-day EMA for your chosen asset using this formula
Step 3: Compute the MACD Line Subtract the 26-day EMA from the 12-day EMA to obtain the MACD Line: MACD Line = 12-day EMA – 26-day EMA
Step 4: Calculate the Signal Line The Signal Line is the 9-day EMA of the MACD Line. Apply the EMA formula (mentioned in Step 2) to the MACD Line values, using a 9-day period: Signal Line = 9-day EMA of the MACD Line
Step 5: Determine the Impulse MACD Now that you have the MACD Line and the Signal Line, you can derive the Impulse MACD by observing their crossover points:
Bullish Impulse: When the MACD Line crosses above the Signal Line, it indicates a potential upward trend or buying opportunity.
Bearish Impulse: When the MACD Line crosses below the Signal Line, it signifies a potential downward trend or selling opportunity.
By following these steps and using the provided mathematical formulas, you can successfully calculate the Impulse MACD and incorporate this valuable technical indicator into your trading strategy.
Comparing MACD and Impulse MACD
When it comes to trading indicators, MACD and Impulse MACD are two of the most popular options among traders. While they share similarities in their calculation methods, there are key differences between the two. In this section, we will compare MACD and Impulse MACD, their signals in different market scenarios, provide a side-by-side comparison in a table format, and explain why Impulse MACD may be a better choice for traders.
Both MACD and Impulse MACD are calculated using exponential moving averages (EMA) and are used to identify potential trend changes and buy/sell signals. However, there are several differences between the two. MACD is based on a longer time frame, using a 26-period EMA and a 12-period EMA, while Impulse MACD is based on a shorter time frame, using a 25-period EMA and a 13-period EMA. This means that Impulse MACD is more responsive to short-term market changes.
In terms of the signals generated by both indicators, MACD is known for its ability to identify potential trend changes and momentum shifts. A bullish crossover occurs when the MACD line crosses above the signal line, indicating a potential buy signal, while a bearish crossover occurs when the MACD line crosses below the signal line, indicating a potential sell signal.
Impulse MACD, on the other hand, is known for its ability to identify trend changes earlier and provide a clearer trend direction. A bullish crossover occurs when the impulse line crosses above the trigger line, indicating a potential buy signal, while a bearish crossover occurs when the impulse line crosses below the trigger line, indicating a potential sell signal.
To provide a clearer comparison, the table below summarizes the key differences between MACD and Impulse MACD:
| Indicator | Calculation | Timeframe | Signals |
|---|---|---|---|
| MACD | 12-26 EMA | Longer | Momentum |
| shifts | |||
| Impulse | 13-25 EMA | Shorter | Trend |
| MACD | changes |
While both indicators have their strengths, Impulse MACD may be a better choice for traders who are looking for a more responsive and dynamic trading indicator. Its ability to identify trend changes earlier, provide a clearer trend direction, and filter out noise in the market can be a valuable asset in fast-paced market environments.
Conclusion
In this article, we explored the concepts of technical analysis and the importance of using trading indicators. We introduced two popular indicators, MACD and Impulse MACD, and compared their differences in calculation methods, signals, and effectiveness in different market scenarios.
While both indicators can be valuable tools for traders, we highlighted the advantages of using Impulse MACD over MACD. Impulse MACD is more responsive to short-term market changes, can identify trend changes earlier, provide a clearer trend direction, and filter out noise in the market.
We encourage readers to try Impulse MACD in their trading strategy, particularly those who are looking for a more dynamic and responsive trading indicator. However, traders should carefully consider their trading strategies and market conditions when selecting which indicator to use, and use it in conjunction with other indicators and strategies.
FAQs
Impulse MACD is a technical indicator that measures momentum and trend direction in financial markets. It differs from MACD in that it is more responsive to short-term market changes, can identify trend changes earlier, and filters out noise in the market.
Impulse MACD can benefit your trading strategy by providing more accurate and timely analysis of market movements. It can help you identify potential trend changes, filter out market noise, and provide a clearer trend direction. This can lead to better trading decisions and improved overall performance.
Yes, Impulse MACD can help you identify trend changes earlier than other indicators. Its responsiveness to short-term market changes makes it a powerful tool for traders who want to stay ahead of market trends.
Impulse MACD filters out market noise by using a unique calculation method that eliminates false signals and focuses on the most important market movements. This can help traders make more accurate and informed trading decisions.
The main limitation of MACD is that it is a lagging indicator, meaning that it can be slow to react to changes in the market. Impulse MACD addresses this limitation by being more responsive to short-term market changes, providing earlier signals of trend changes, and filtering out noise in the market.
Impulse MACD is calculated using a formula that combines three components: impulse line, trigger line, and histogram. The formula can be found online and used in most trading platforms.
Impulse MACD is best suited for trending markets, but can also be used in range-bound markets. Traders should adjust their strategy accordingly based on market conditions and the signals generated by the indicator.
Yes, Impulse MACD can be used in combination with other indicators. Some indicators that work well with Impulse MACD include moving averages, trendlines, and support and resistance levels.
One common mistake to avoid when using Impulse MACD is to rely solely on the indicator and ignore other important factors that can influence market movements. Traders should use Impulse MACD in conjunction with other indicators and strategies, and carefully consider market conditions before making any trading decisions.
Impulse MACD signals can be interpreted based on the direction and magnitude of the impulse line, trigger line, and histogram. Traders should take action based on the signals generated by the indicator, such as entering or exiting a position, adjusting stop loss orders, or taking profits.
Ainu Token aims to offer impartial and trustworthy information on cryptocurrency, finance, trading, and shares. However, we don't provide financial advice and recommend users to conduct their own studies and thorough checks.
Comments (No)