When it comes to trading cryptocurrencies, one popular approach is scalping, which involves making quick trades to capture small price movements. Traders often use short time frames, such as 5-minute charts, to identify these opportunities. In this article, we’ll explore a backtesting strategy specifically designed for scalping Bitcoin using three indicators: DoubleEMA + ATR Trend Follower, Follow Line Indicator, and ADX and DI.
The scalping strategy for trading cryptocurrencies focuses on entry rules for both long and short positions using indicators like DoubleEMA + ATR Trend Follower, Follow Line Indicator, and ADX and DI. Avoiding repainting indicators and using the bar replay method in backtesting ensures accuracy. Traders should adapt strategies to current market conditions despite past performance.
The Power of Scalping
Scalping is a trading technique that aims to profit from small price differentials in the market. Traders who employ this strategy are commonly referred to as scalpers. They enter and exit trades quickly, often within seconds or minutes, seizing opportunities in volatile markets.
Scalping can be particularly effective in the cryptocurrency market, where price movements can occur rapidly. Bitcoin, being the most well-known and widely traded cryptocurrency, offers ample opportunities for scalping. The strategy we’ll explore in this article focuses specifically on Bitcoin and utilizes three key indicators to aid decision-making.
The Indicators: DoubleEMA + ATR Trend Follower, Follow Line Indicator, and ADX and DI
To enhance the scalping strategy, we will incorporate three indicators: DoubleEMA + ATR Trend Follower, Follow Line Indicator, and ADX and DI. These indicators play a crucial role in analyzing market trends, gauging volatility levels, and identifying potential entry points for trades.
The DoubleEMA + ATR Trend Follower indicator helps determine the direction of the trend by using exponential moving averages and the average true range (ATR). This combination allows traders to assess the strength of the trend and adjust their trading approach accordingly. The Follow Line Indicator complements the DoubleEMA + ATR Trend Follower by tracking the price movement relative to the indicator’s line. It provides additional confirmation of the trend and assists traders in making informed trading decisions. Lastly, the ADX and DI indicators assist in measuring the strength of the trend and identifying whether it is suitable for scalping. By considering these indicators collectively, traders can gain valuable insights and enhance their scalping strategy for optimal results.
DoubleEMA + ATR Trend Follower
The DoubleEMA + ATR Trend Follower indicator is a powerful tool that combines the Double Exponential Moving Average (DoubleEMA) and the Average True Range (ATR) to identify trend reversals in the market. The DoubleEMA smooths out price data and provides a clearer representation of the underlying trend. Meanwhile, the ATR measures volatility, allowing traders to gauge the potential price range of an asset.
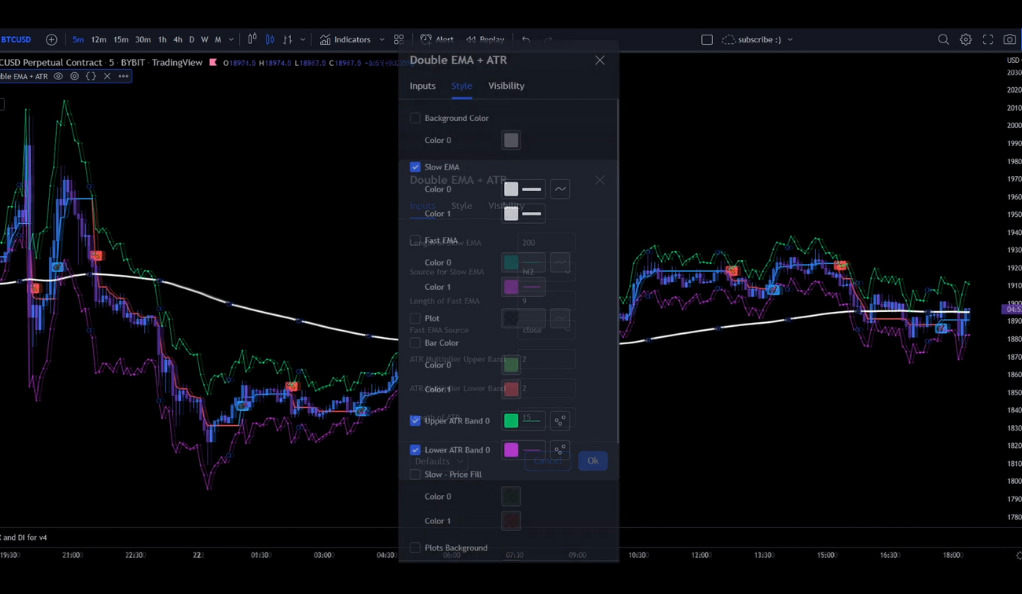
By utilizing this indicator, traders can identify when a market is transitioning from a bullish trend to a bearish trend or vice versa. This information is crucial for making timely trading decisions and entering trades at favorable prices. The DoubleEMA + ATR Trend Follower indicator enhances the scalping strategy by providing valuable insights into market trends and helping traders capitalize on profitable trading opportunities.
Follow Line Indicator
The Follow Line Indicator is a widely used tool in technical analysis that assists traders in identifying support and resistance levels. It accomplishes this by drawing a line on the chart that represents the average price movement over a specific period. This line provides valuable insights into potential price levels where the market may reverse or consolidate.
By using the Follow Line Indicator, traders can visually assess the price dynamics and identify key levels that have historically acted as support or resistance. These levels can offer trading opportunities as the market reacts to them. Traders can utilize this information to make informed decisions about entry and exit points, manage risk, and potentially improve their trading outcomes. The Follow Line Indicator enhances the scalping strategy by providing a clear representation of important price levels, helping traders navigate the market more effectively.
ADX and DI
The ADX (Average Directional Index) and DI (Directional Indicator) are essential technical indicators used to gauge the strength of a market trend. The ADX indicator provides a numerical value that represents the strength of the trend, regardless of its direction. Higher ADX values indicate a stronger trend, while lower values indicate a weaker or ranging market. On the other hand, the DI indicators (Positive DI and Negative DI) help traders determine the direction of the trend. Positive DI measures the strength of upward price movement, while Negative DI measures the strength of downward price movement.
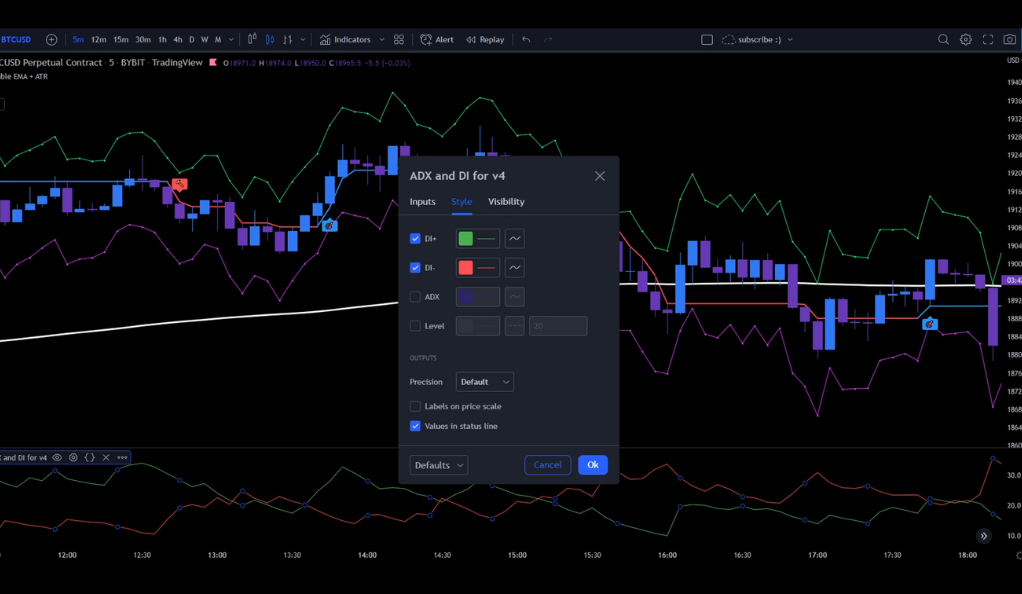
By utilizing the ADX and DI indicators, traders can gain valuable insights into the overall strength and direction of a trend. This information enables them to make more informed entry and exit decisions. For scalping strategies, it is crucial to identify strong trending markets, as they offer better opportunities for capturing quick price movements. Conversely, ranging markets may indicate lower volatility and less favorable conditions for scalping. By incorporating ADX and DI into the scalping strategy, traders can enhance their ability to identify trending markets and adjust their trading approach accordingly for improved results.
The Entry Rules: Long and Short Positions
Now let’s explore the entry rules for long and short positions within the scalping strategy.
Long Positions
When it comes to long position entry rules within the scalping strategy, there are several key conditions to consider. Firstly, the DoubleEMA + ATR Trend Follower indicator should indicate a bullish reversal signal. This signal suggests a potential shift from a bearish trend to a bullish trend, providing an initial indication for considering a long position. Traders should closely monitor this indicator for the desired bullish signal.
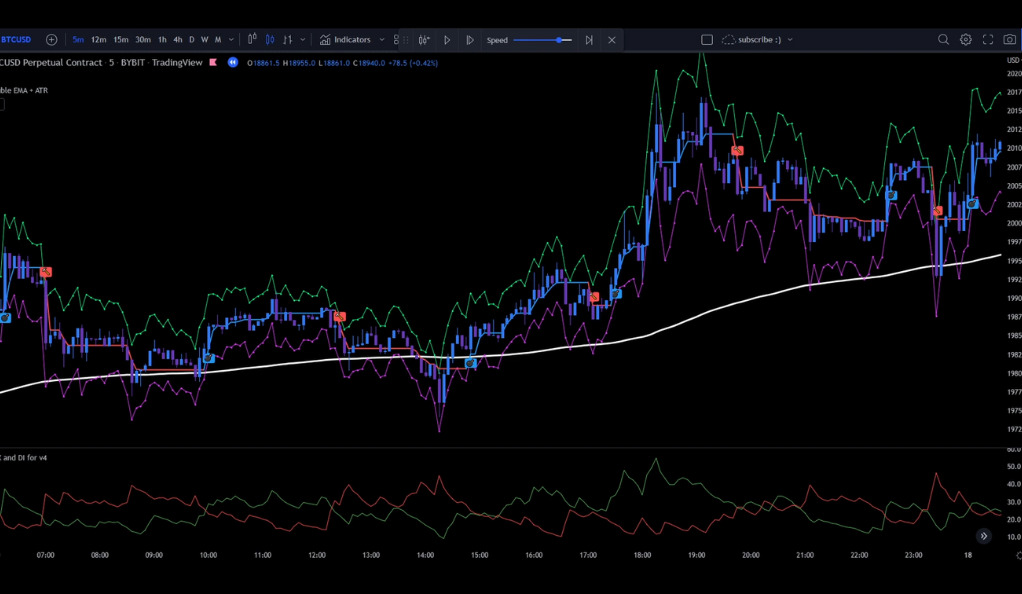
Secondly, the Follow Line Indicator plays a crucial role in long position entry rules. It is essential to observe whether the indicator identifies a support level being reached. This indicates that the price has reached a level where buying pressure may increase, creating a favorable environment for entering a long position. By confirming the presence of a support level, traders can gain additional confidence in their decision to enter a long position.
Short Positions
Firstly, the DoubleEMA + ATR Trend Follower indicator should display a bearish reversal signal. This signal indicates a potential shift from a bullish trend to a bearish trend, serving as an initial indication for considering a short position. Traders should closely monitor this indicator to identify the desired bearish signal.
Secondly, the Follow Line Indicator plays a crucial role in short position entry rules. Traders should observe whether the indicator indicates a resistance level being reached. This suggests that the price has reached a level where selling pressure may increase, creating a favorable environment for entering a short position. Confirming the presence of a resistance level provides additional confidence in the decision to enter a short position.
Avoiding Repainting Indicators and Bar Replay Method
To ensure accurate backtesting of a trading strategy, it is crucial to avoid using repainting indicators. Repainting refers to indicators that change their past values based on future price action, which can lead to misleading historical signals. Repainting indicators can create a false sense of profitability during backtesting, making it important to rely on indicators that provide consistent and reliable signals throughout the historical data.
In addition to avoiding repainting indicators, utilizing the bar replay method is highly recommended for reliable backtesting. The bar replay method allows traders to simulate real-time trading conditions by replaying historical price action. This enables them to test their strategies with the same timing and order of events that would occur in live trading. By incorporating the bar replay method, traders can accurately assess the performance of their strategies, considering factors such as slippage, order execution delays, and other market conditions that impact real-time trading.
By avoiding repainting indicators and utilizing the bar replay method, traders can ensure more robust and accurate backtesting results. This helps in developing a realistic understanding of how their strategies would perform in live trading situations, enabling them to make informed decisions and adapt their approaches accordingly.
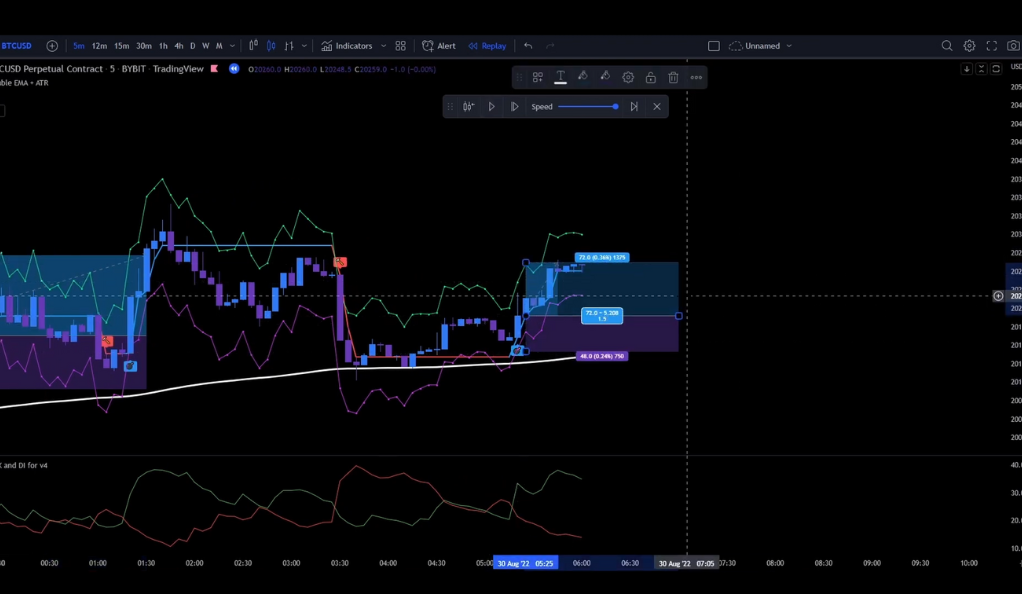
Backtesting Results and Performance
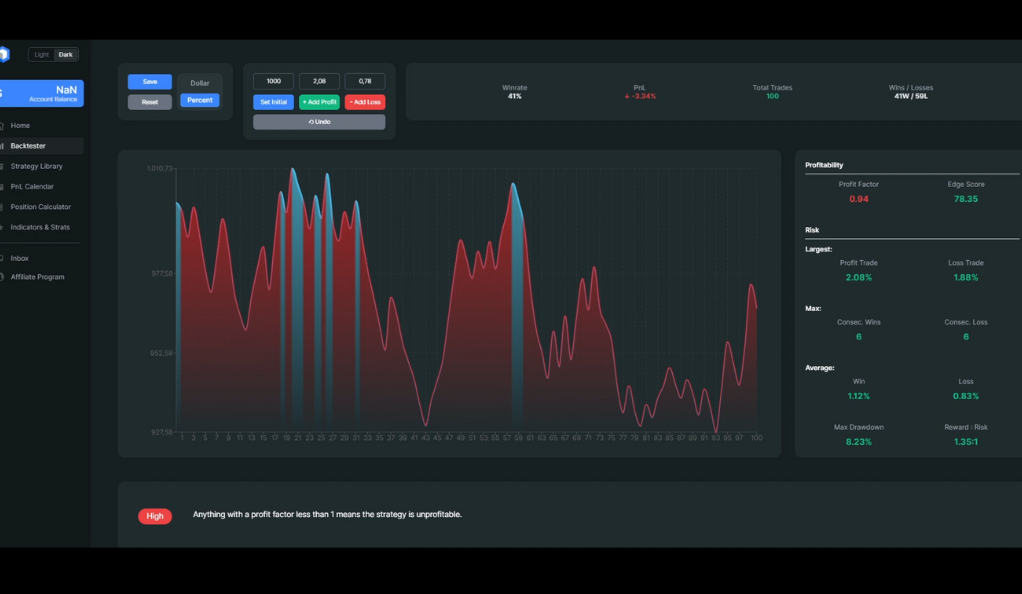
The scalping strategy was evaluated by conducting backtesting on 5-minute Bitcoin charts over a 24-day period, encompassing a total of 100 trades. The results revealed a win rate of 41%, indicating that 41 trades out of the 100 were profitable. However, despite the positive win rate, the overall Profit and Loss (PnL) stood at -3.34%, indicating a slight loss during the backtesting period.
It is crucial to recognize that backtesting results serve as a historical reference and do not guarantee future performance. The market conditions during the backtesting period may not accurately reflect the current or future market environment. Traders should remain vigilant and regularly assess their strategies to adapt to changing market dynamics. Continuous evaluation, learning from past performance, and incorporating risk management measures are essential for improving trading performance over time.
Conclusion
Scalping Bitcoin using a 5-minute chart can be a profitable trading strategy, provided one follows a well-defined approach and utilizes appropriate indicators. The combination of the DoubleEMA + ATR Trend Follower, Follow Line Indicator, and ADX and DI offers insights into trend reversals, support and resistance levels, and market strength. However, backtesting results showed a slight loss during the tested period, highlighting the importance of continuous strategy evaluation and adaptation.
Remember, trading always carries risks, and it’s crucial to exercise caution and apply risk management techniques. By combining sound trading principles, technical analysis, and disciplined execution, traders can increase their chances of success in the dynamic world of cryptocurrency scalping.
Ainu Token aims to offer impartial and trustworthy information on cryptocurrency, finance, trading, and shares. However, we don't provide financial advice and recommend users to conduct their own studies and thorough checks.
Comments (No)