In the high-stakes world of cryptocurrency trading, a well-crafted strategy is the cornerstone of success. This article will explore a unique trading strategy that leverages three powerful indicators: Trendlines with Breaks [Lux] by LuxAlgo, the Exponential Moving Average (EMA), and Volume. We will delve into the nuances of this strategy, with a particular focus on its application to Bitcoin trading on a 5-minute timeframe.
The Power of Indicators
Indicators are the compass and roadmap of every trader, serving as invaluable tools in the often unpredictable landscape of cryptocurrency trading. They are mathematical calculations based on a currency pair’s price and volume, providing valuable insights into market trends, price momentum, and trading volume.
Market trends are the general direction in which a market is moving. Indicators like the Trendlines with Breaks [Lux] by LuxAlgo can help traders identify these trends, providing a clear picture of the market’s direction. Understanding market trends is crucial as it allows traders to align their trades with the market’s momentum, increasing their chances of success.
Price momentum, on the other hand, refers to the rate of change in the price of an asset. Momentum indicators like the Exponential Moving Average (EMA) can help traders identify the speed and strength of a price movement. This can provide early signals of potential market reversals, allowing traders to capitalize on price swings.
Trading volume is the total number of shares or contracts traded in a specific period. Volume indicators, such as the Volume Indicator used in this strategy, can provide insights into the strength of a price move. A high volume indicates a strong price move, while a low volume may suggest a weaker move. Understanding trading volume can help traders gauge market sentiment, providing clues about potential future market movements.
Trendlines with Breaks [Lux] by LuxAlgo: A New Spin on a Classic Tool
Trendlines have long been a staple in a trader’s toolkit. They are simple yet powerful tools that provide valuable insights into the market’s direction. By connecting a series of highs or lows, trendlines help traders visualize the trend and identify potential reversal points.
The Trendlines with Breaks [Lux] by LuxAlgo takes this classic tool a step further. It incorporates breaks in the trendline, which can provide traders with potent buy or sell signals. But what exactly are these breaks, and why are they significant?
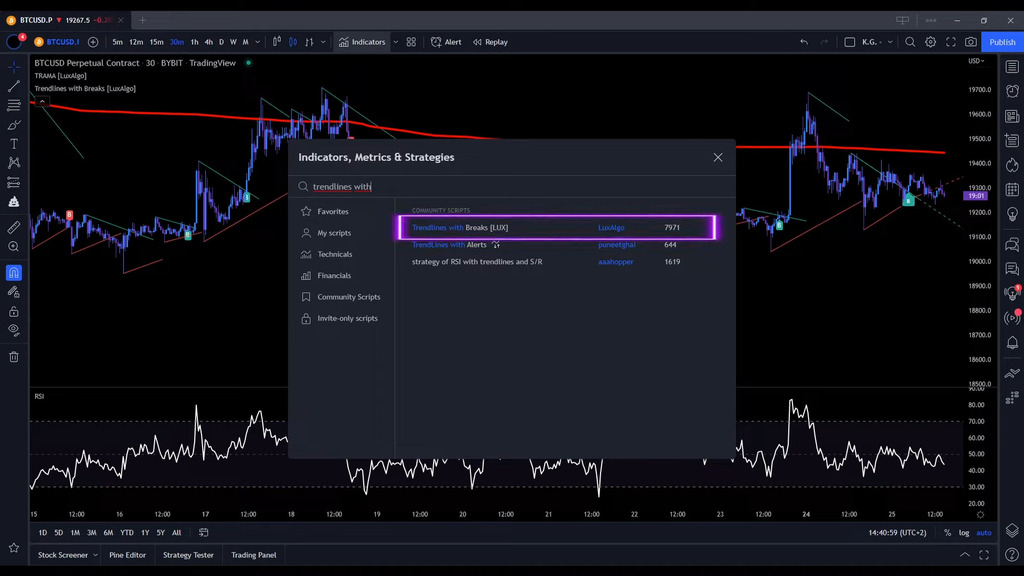
A break occurs when the price of an asset crosses a trendline. In a rising trend, a break below the trendline can signal a potential reversal to the downside. Conversely, in a falling trend, a break above the trendline can signal a potential reversal to the upside. These breaks can indicate that the prevailing trend is losing momentum, and a new trend may be about to start.
The Trendlines with Breaks [Lux] by LuxAlgo identifies these breaks and generates buy or sell signals accordingly. A green signal indicates a break above a falling trendline, suggesting a potential buy opportunity. A red signal indicates a break below a rising trendline, suggesting a potential sell opportunity.
Exponential Moving Average (EMA): A Closer Look at the 200 EMA Line
The Exponential Moving Average (EMA) is a type of moving average that places a greater weight and significance on the most recent data points. Unlike the simple moving average, which treats all data points equally, the EMA is more responsive to recent price changes. This responsiveness makes the EMA a favorite among traders looking to capitalize on short-term trends and price movements.
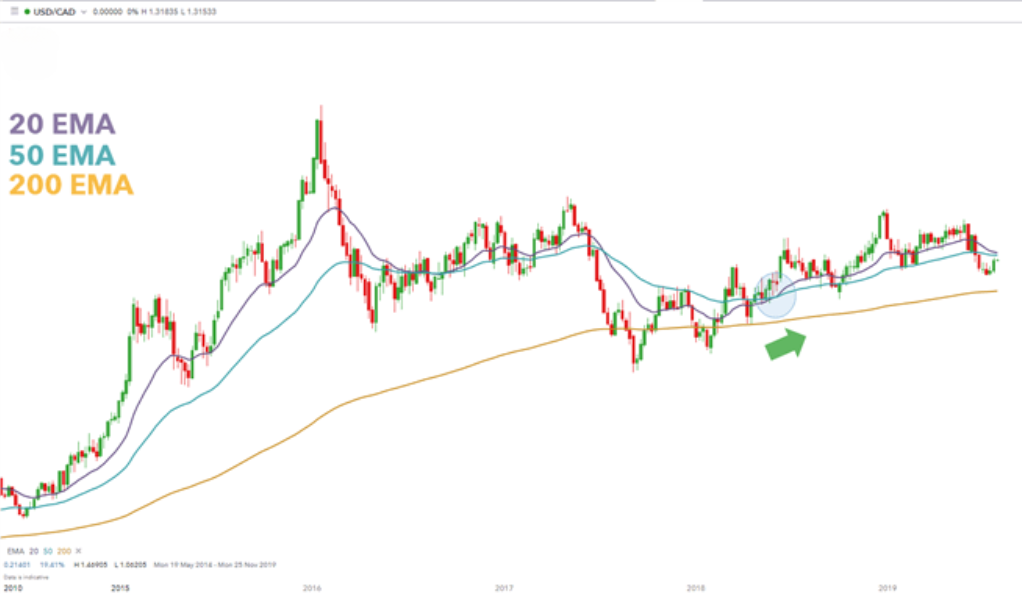
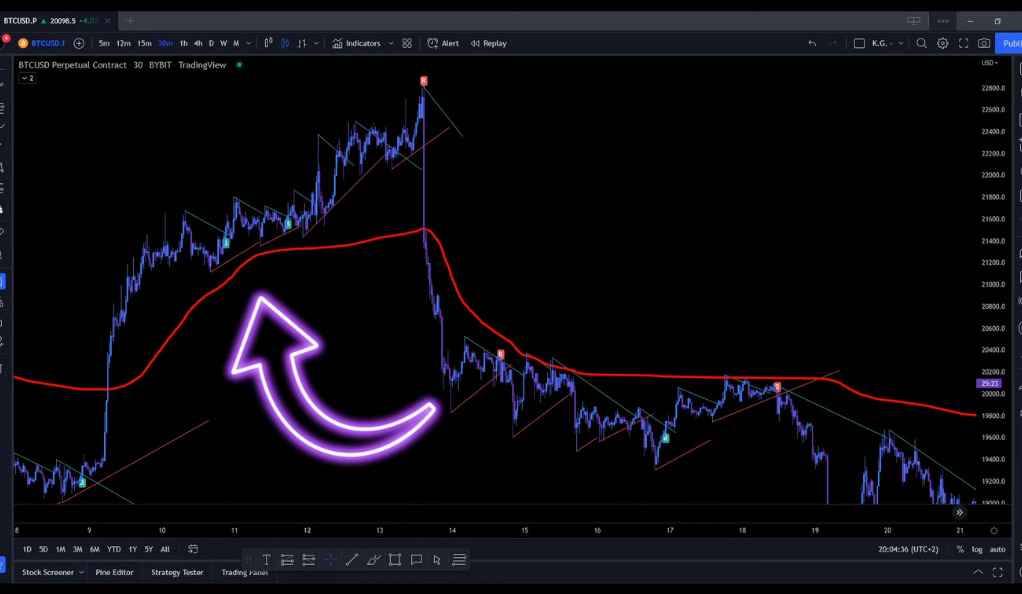
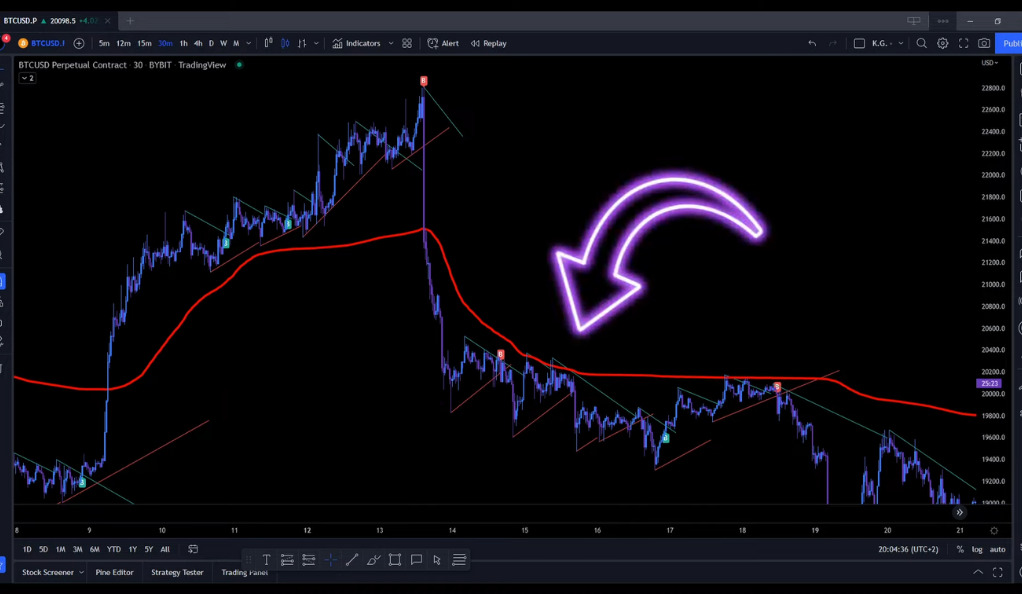
The 200 EMA line, in particular, holds a special place in the world of trading. It’s a critical level that traders across the globe monitor closely. But why is the 200 EMA line so significant? The answer lies in its ability to act as a dynamic support or resistance level.
In technical analysis, support and resistance levels are key concepts that help traders understand the levels at which the price of an asset is likely to reverse. Support levels represent a price level that the asset has trouble falling below, while resistance levels represent a price level that the asset has trouble breaking above.
Volume Indicator: The Unsung Hero of Trading Indicators
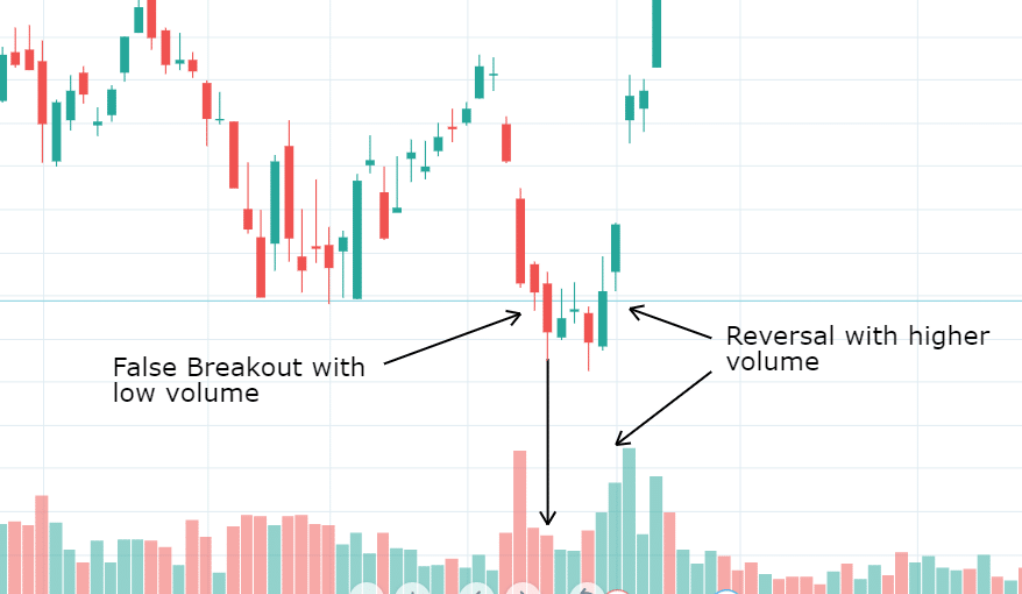
The Volume Indicator is a tool that reveals the amount of Bitcoin traded during a specific period. It’s an integral part of this strategy because it can confirm the strength of a trend. A green or red candle closing above the 30 MA Line is a strong signal for potential long or short positions, respectively. This indicator provides a deeper understanding of market sentiment, enabling traders to make more informed decisions.
Implementing the Strategy
Implementing a trading strategy effectively requires a deep understanding of the indicators involved and the ability to interpret their signals accurately. It’s about finding the perfect harmony between Trendlines, EMA, and Volume indicators to identify potential trading opportunities. Successful implementation hinges on the precise timing of entry and exit points, backed by robust risk management practices.
Going Long: A Confluence of Bullish Signals
When the price is above the 200 EMA Line, a green buy signal emerges, and a green candle in the Volume Indicator closes above the 30 MA Line, it’s time to consider a long position.
The price above the 200 EMA Line suggests a bullish trend. The green buy signal further confirms this bullish sentiment. The green candle in the Volume Indicator closing above the 30 MA Line indicates strong buying pressure. When these signals align, they suggest a high probability of the price continuing to rise, making it an opportune time to go long.
Going Short: Reading the Bearish Signals
Conversely, if the price is below the 200 EMA Line, there’s a red sell signal, and a red candle in the Volume Indicator closes above the 30 MA Line, it’s a signal to consider a short position.
The price below the 200 EMA Line suggests a bearish trend. The red sell signal further confirms this bearish sentiment. The red candle in the Volume Indicator closing above the 30 MA Line indicates strong selling pressure. When these signals align, they suggest a high probability of the price continuing to fall, making it an opportune time to go short.
Risk Management: The Key to Sustainable Trading
Risk management is the unsung hero of any successful trading strategy. It’s the safety net that catches traders when market movements don’t go as planned. It’s not just about making profits; it’s about protecting your capital, ensuring that you live to trade another day.
One of the most fundamental aspects of risk management is setting stop losses. A stop loss is a predetermined level at which a trader will exit a trade if the market moves unfavorably. It’s a trader’s best defense against significant losses. By setting a stop loss, traders can limit their losses to a manageable amount, preventing any single trade from wiping out a significant portion of their trading capital.
Backtesting: Validating Your Strategy
Backtesting is a critical step in the process of validating any trading strategy. It’s the equivalent of a dress rehearsal before the live performance, allowing traders to test their strategies against historical data to see how they would have performed under past market conditions.
The process of backtesting involves applying your trading strategy to historical price data and recording the trades that would have occurred. This includes identifying the exact entry and exit points, the duration of each trade, and the profit or loss from each trade. By doing this, traders can get a realistic picture of the strategy’s potential profitability and risk.
Backtesting can provide valuable insights into a strategy’s effectiveness. It can help identify the strategy’s strengths and weaknesses, such as periods of drawdown, the average profit or loss per trade, and the percentage of winning trades. These insights can help traders understand the potential risks and rewards of the strategy and make informed decisions about whether to implement it.
Conclusion
In conclusion, the combination of Trendlines with Breaks [Lux] by LuxAlgo, EMA, and Volume indicators can form a powerful trading strategy. However, it’s essential to remember that no strategy is foolproof. Always employ risk management techniques and backtest your strategy before diving into the live markets. Remember, in the world of trading, knowledge is power.
Ainu Token aims to offer impartial and trustworthy information on cryptocurrency, finance, trading, and shares. However, we don't provide financial advice and recommend users to conduct their own studies and thorough checks.
Comments (No)