In the world of trading, there’s a constant quest for the perfect indicator, the magic tool that can predict market movements with unerring accuracy. But what if I told you that the secret to successful trading isn’t hidden in complex algorithms but in the simple patterns of price action? Welcome to the world of the ABC Indicator, a unique tool that leverages price action to identify profitable trading opportunities.
Understanding the ABC Indicator
The ABC Indicator is a groundbreaking tool in the trading world, designed to harness the power of price action to identify a specific market pattern. Unlike conventional indicators that track volume or momentum, the ABC Indicator focuses on the raw and unfiltered movements of price action, the very pulse of the market. This pattern, known as the ABC pattern, is a recurring phenomenon in the market and has demonstrated a high degree of success when used correctly.
The ABC Indicator is a product of meticulous coding and a deep understanding of market dynamics. It’s designed to look for a particular pattern in the market, a pattern that has proven to be highly successful in predicting market movements. This pattern is constantly being generated throughout the market, and if used correctly, it can lead to significant trading success. The ABC Indicator is not just any indicator; it’s a tool that uses price action, the most fundamental aspect of any market, to generate profitable trading signals.
The Magic of the ABC Pattern
The ABC pattern, the cornerstone of the ABC Indicator, is a simple yet potent formation that can be found in any market, be it stocks, forex, or crypto. This pattern is a three-point formation that begins with a trend (Point A), followed by a reversal (Point B), and ends with a pullback (Point C). The beauty of this pattern lies in its simplicity and versatility. It can be used on any timeframe and in any market condition, making it a truly universal trading tool.

The ABC pattern is a testament to the power of simplicity in trading. It’s a pattern that’s easy to understand, easy to spot, and easy to trade. It’s a pattern that’s constantly being generated in the market, and if used correctly, it can lead to significant trading success. The ABC pattern is not just a pattern; it’s a trading strategy that can be used to trade any market, any timeframe, and any asset class.
The magic of the ABC pattern lies in its ability to capture the essential rhythm of the market. It identifies the natural ebb and flow of price action, pinpointing the moments of trend, reversal, and pullback that are the lifeblood of any market. This pattern, in its simplicity, captures the essence of market dynamics, providing traders with a clear and straightforward roadmap for navigating the often chaotic and unpredictable world of trading.
Moreover, the ABC pattern is not just about identifying trends and reversals. It’s about understanding the underlying psychology of the market. Point A represents the exhaustion of a trend, Point B the reversal of sentiment, and Point C the confirmation of the new trend. By understanding and trading the ABC pattern, traders are not just following price action; they are tapping into the collective psychology of the market, gaining an edge that can lead to significant trading success.
How Does the ABC Indicator Work?
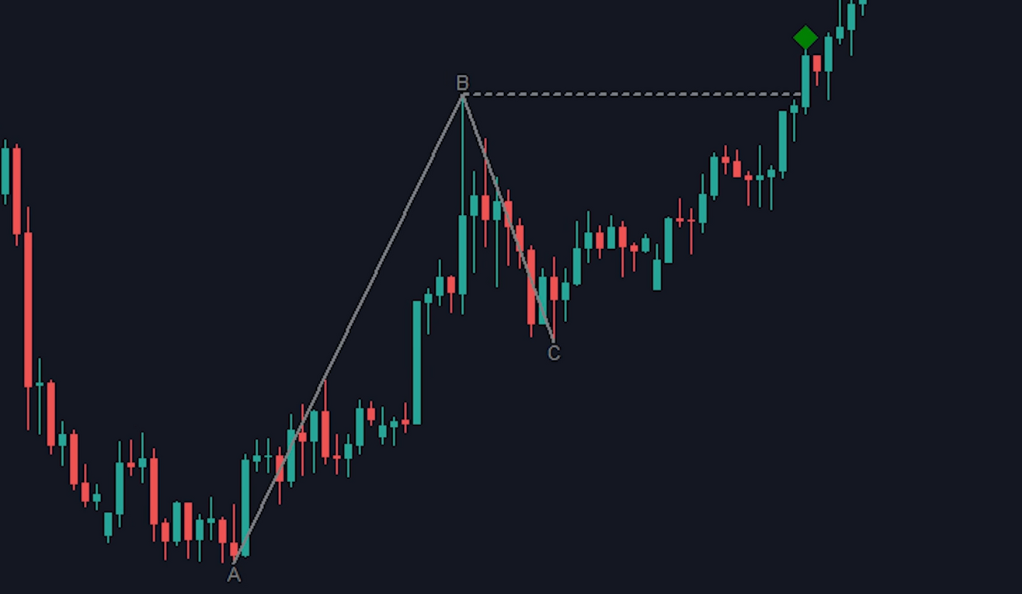
The ABC Indicator works by identifying and highlighting the ABC pattern on your trading chart. It automatically draws the lines and points for you, making it easy to spot potential trading opportunities. Once the pattern is formed, the indicator signals the trader to enter a trade once the price breaks the level of Point B. This break is a signal that the market momentum is strong, and there’s a high probability that the price will continue in the direction of the break.
The ABC Indicator is designed to make trading as simple and straightforward as possible. It does all the heavy lifting for you, identifying potential trading opportunities and signaling when to enter a trade. All you have to do is follow the signals and execute your trades. The ABC Indicator is not just a tool; it’s a trading companion that guides you through the market, helping you make informed and profitable trading decisions.
Enhancing the ABC Indicator with the RSI
While the ABC Indicator is a powerful tool on its own, it can be further enhanced with the use of the Relative Strength Index (RSI). The RSI is a momentum oscillator that measures the speed and change of price movements. By adding the RSI to the ABC Indicator, traders can confirm the signals and filter out potential false signals, thereby increasing the win rate of the strategy.
The RSI is a powerful tool that can help traders identify overbought and oversold conditions in the market. When used in conjunction with the ABC Indicator, it can provide additional confirmation of the signals generated by the ABC Indicator. This combination of tools can help traders increase their win rate, reduce their risk, and improve their overall trading performance.
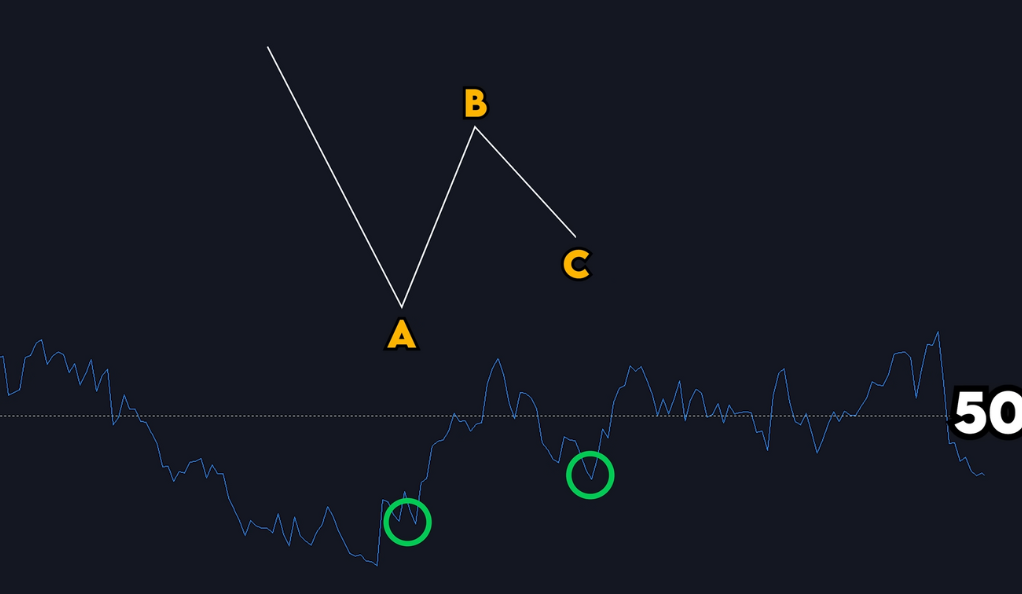
The RSI works by comparing the magnitude of recent gains to recent losses in an attempt to determine overbought and oversold conditions of an asset. When the RSI is above 70, it indicates that the asset may be overbought, suggesting that it may be a good time to sell. Conversely, when the RSI is below 30, it indicates that the asset may be oversold, suggesting that it may be a good time to buy.
By integrating the RSI with the ABC Indicator, traders can add an extra layer of confirmation to their trading signals. For example, if the ABC Indicator signals a buy opportunity, and the RSI is below 30, this could provide a strong confirmation of the signal. Similarly, if the ABC Indicator signals a sell opportunity, and the RSI is above 70, this could also provide a strong confirmation of the signal.
The Secret Trick: Using Support and Resistance Levels
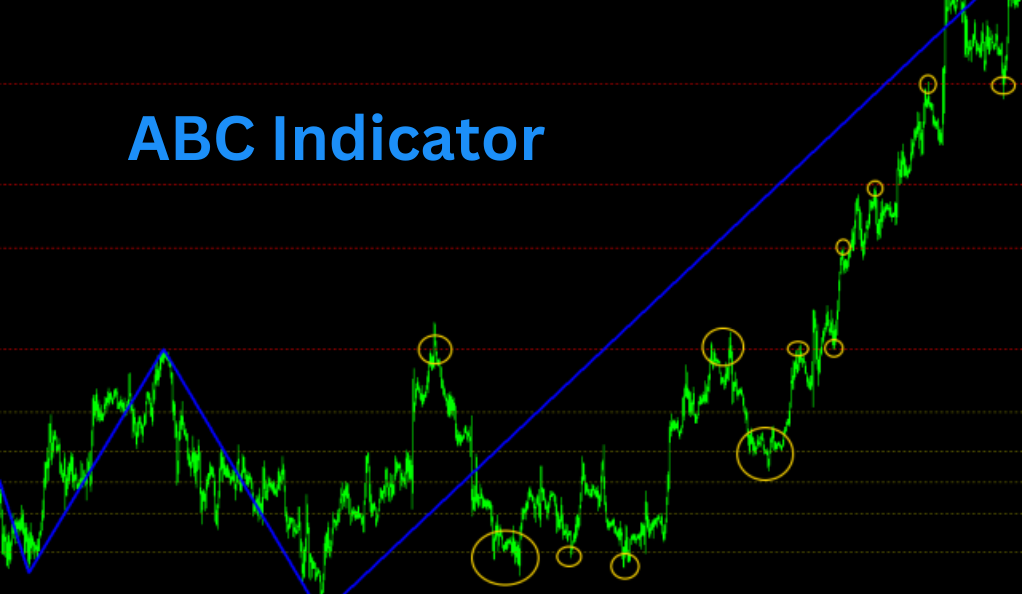
The secret trick to optimizing the ABC Indicator lies in the strategic use of support and resistance levels. These are the price levels at which the market has historically shown a reaction, making them significant in predicting future price movements. If Point A of the ABC pattern aligns with a strong support level on a higher timeframe, it significantly bolsters the likelihood of a successful trade. This is because support and resistance levels act as psychological barriers in the market where price often rebounds.
Support and resistance levels are fundamental concepts in technical analysis. They represent the levels where the price has historically had difficulty breaking through. When the price approaches these levels, it tends to bounce back, making them ideal points for entry or exit. By combining the ABC Indicator with support and resistance levels, traders can increase the effectiveness of the indicator and improve their trading performance.
For instance, if Point A of the ABC pattern is at a strong support level, it indicates that the price has a high probability of bouncing back. This increases the chances of a successful trade, as the price is likely to follow the ABC pattern and move upwards. Similarly, if Point A is at a strong resistance level in a bearish market, it indicates a high probability of the price falling, following the ABC pattern.
Moreover, using support and resistance levels with the ABC Indicator allows traders to set more accurate stop loss and take profit levels. The support and resistance levels provide clear boundaries for the price movement, allowing traders to manage their risk more effectively.
The ABC Indicator: A Gift to Traders
The ABC Indicator is more than just a trading tool; it’s a gift to traders. It’s a testament to the power of simplicity and the importance of price action in trading. It’s a tool that empowers traders to take control of their trading decisions and not rely solely on complex algorithms or indicators.
The ABC Indicator is a gift to traders because it simplifies the trading process. It takes the complexity out of trading and makes it accessible to everyone, regardless of their trading experience or knowledge. It’s a tool that can help traders improve their trading performance, reduce their risk, and achieve their trading goals.
The ABC Indicator is a gift because it provides a clear and straightforward approach to trading. It eliminates the need for complex calculations and intricate strategies, allowing traders to focus on what truly matters – the price action. By focusing on the price action, traders can gain a deeper understanding of the market and make more informed trading decisions.
Moreover, the ABC Indicator is a gift because it’s free. It’s a tool that’s been created out of a desire to give back to the trading community and help traders achieve their trading goals. It’s a tool that’s been created with the belief that everyone should have access to the tools and resources they need to succeed in trading.
Conclusion
In conclusion, the ABC Indicator is a powerful tool that leverages the simplicity of price action to identify profitable trading opportunities. It’s a tool that’s easy to use, versatile, and can be enhanced with other indicators like the RSI. So, if you’re looking for a new trading tool to add to your arsenal, why not give the ABC Indicator a try? After all, it’s not just an indicator; it’s a gift to traders. It’s a tool that can help you navigate the market with confidence and make informed trading decisions.
Ainu Token aims to offer impartial and trustworthy information on cryptocurrency, finance, trading, and shares. However, we don't provide financial advice and recommend users to conduct their own studies and thorough checks.
Comments (No)