In the realm of stock trading, volume refers to the total number of shares or contracts traded within a specific period, typically a day. It represents the level of activity in the market and plays a crucial role in understanding market dynamics. By analyzing volume, traders can gain valuable insights into the strength of price movements and the level of investor interest in a particular stock or market. High volume often accompanies significant price changes, indicating increased market participation and potential trend reversals. Conversely, low volume suggests limited interest or indecision among investors. Understanding volume patterns can help traders identify potential entry and exit points, gauge market sentiment, and make more informed trading decisions.
To maximize profits, traders can utilize volume analysis in conjunction with other technical indicators and chart patterns. For example, they may look for volume surges accompanying price breakouts or breakdowns, as these can indicate strong buying or selling pressure. Additionally, traders often use volume indicators such as the Volume Weighted Average Price (VWAP) or On-Balance Volume (OBV) to assess the strength of a trend or confirm a price move. By integrating volume analysis into their trading strategies, investors can better understand the supply and demand dynamics driving price movements, potentially increasing their chances of making profitable trades.
The Basics of Stock Trading
Stock trading is the process of buying and selling shares of publicly traded companies, typically conducted through stock exchanges. It provides individuals and institutions with the opportunity to invest in and profit from the performance of businesses. To engage in stock trading, one must understand the fundamental concepts and mechanics involved.
First and foremost, it is essential to comprehend the concept of a stock. A stock represents a share of ownership in a company, entitling the shareholder to a portion of its profits and assets. When individuals buy stocks, they become shareholders, and their potential returns come from dividends (a share of the company’s profits distributed to shareholders) and capital appreciation (an increase in the stock’s value over time).
Stock trading can take place in various markets, including national exchanges like the New York Stock Exchange (NYSE) or electronic platforms such as NASDAQ. These markets provide a platform where buyers and sellers can meet to execute trades. Investors can place orders to buy or sell stocks through brokerage accounts, either using the services of a traditional stockbroker or utilizing online trading platforms.
To make informed investment decisions, traders analyze various factors that may impact a company’s stock price. Fundamental analysis involves evaluating a company’s financial health, performance, and future prospects. This analysis includes examining financial statements, assessing industry trends, and considering macroeconomic factors. On the other hand, technical analysis focuses on analyzing historical price and volume data to identify patterns and trends that can guide trading decisions.
Understanding Market Movers
First and foremost, it’s essential to comprehend who is moving the market and creating trends. Remember, a stock won’t move without buyers or sellers. It’s like a dance floor – without dancers, there’s no movement, no energy. The same applies to the stock market. Volume is a good way to gauge this energy, this movement. It’s the number of shares or contracts traded in a security or an entire market during a given period.
How to Read Volume
Reading volume in stock trading is akin to understanding the pulse of the market. It’s about gauging the number of shares or contracts traded within a specific period. When volume increases, it signifies a strong interest in the stock, indicating a strong trend, either upwards or downwards. Conversely, a decrease in volume can suggest a weakening trend or a potential shift in market direction. It’s important to remember that volume doesn’t indicate the direction of the trend, but rather the strength of the momentum. By learning to read volume, traders can gain valuable insights into market trends and potential shifts, aiding in more informed decision-making.
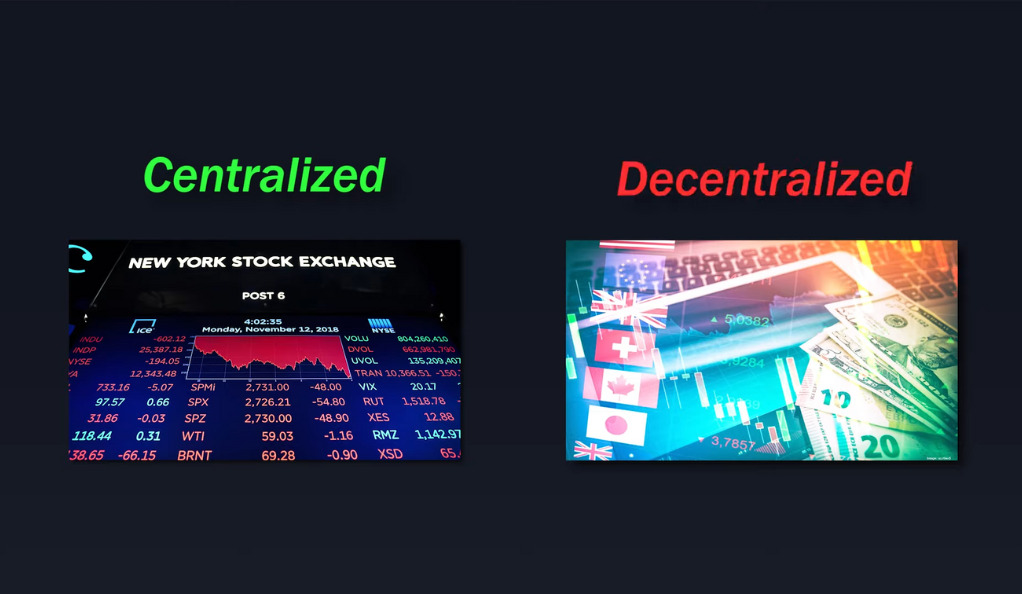
Volume in Stock vs Forex Market
Interestingly, volume works differently in the stock market compared to the forex market. Why is that? The stock market is centralized, meaning all trades are routed towards one central exchange. It’s like a river flowing into a sea, all the water (or trades, in our case) ends up in one place.
On the other hand, the forex market is decentralized. There’s no one location where currencies are traded. It’s more like rain falling on a landscape, with droplets landing in different places. Therefore, volume in forex can be misleading as it only represents trades with a particular broker. It’s like trying to measure the rainfall in an entire city by only looking at one neighborhood.
Advanced Trading Concepts
In addition to the basic principles of stock trading, there are several advanced concepts that experienced traders employ to enhance their strategies and potentially increase their profits.
One such concept is leverage. Leverage allows traders to control a larger position in the market with a smaller amount of capital. By borrowing funds from a broker, traders can amplify their buying power and potentially generate higher returns. However, leverage also carries higher risk, as losses are magnified in the same proportion as gains. It is crucial for traders to use leverage judiciously and understand the potential consequences of increased market exposure.
Another important concept in advanced trading is risk management. Successful traders understand the significance of preserving capital and limiting losses. They utilize various risk management techniques such as setting stop-loss orders, which automatically sell a stock if it reaches a predetermined price level. This helps protect against substantial losses if a trade moves against expectations. Traders also diversify their portfolios by spreading investments across different asset classes, sectors, and geographical regions. This diversification strategy helps mitigate risk by reducing the impact of adverse events on the overall portfolio.
Advanced traders also employ technical analysis tools and indicators to identify potential trading opportunities. These tools include moving averages, oscillators, and chart patterns. Moving averages help identify trends and provide support and resistance levels, while oscillators indicate overbought or oversold conditions. Chart patterns, such as head and shoulders or double tops/bottoms, offer insights into potential trend reversals. By combining these tools with their knowledge of volume analysis and market sentiment, experienced traders can develop more refined trading strategies.
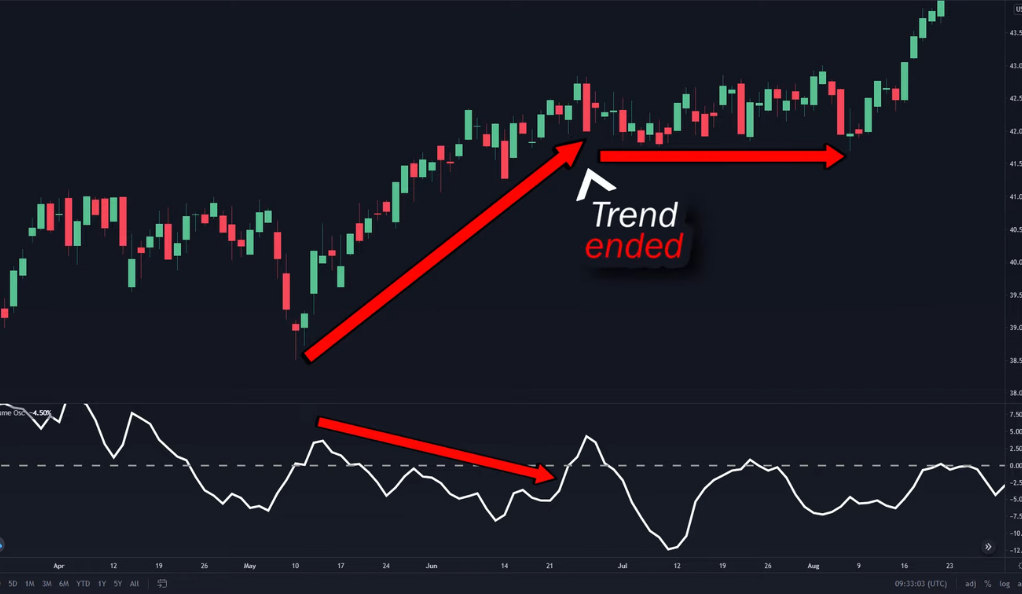
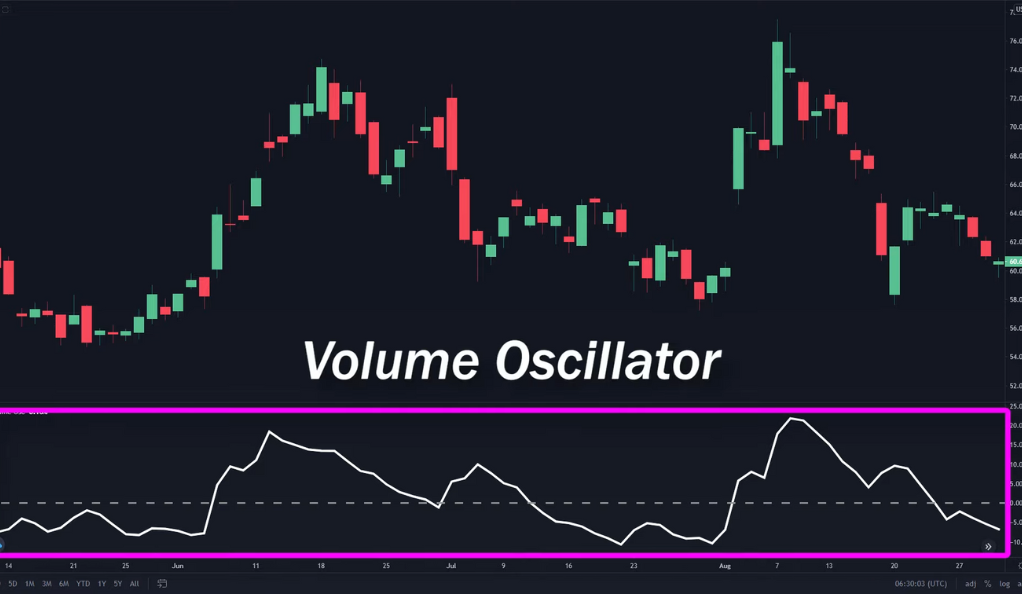
The Power of the Volume Oscillator
Enter the volume oscillator, a powerful tool used to measure momentum. It’s like a speedometer for your car, showing you how fast the market is moving. But instead of measuring speed, it measures the strength of the momentum. An increasing volume indicates a strong trend, whether upwards or downwards.
The volume oscillator settings can be adjusted based on the time frame of trading. It’s like adjusting the sensitivity of your speedometer. For longer time frames, like the daily chart, you might want to use a lower sensitivity. For shorter time frames, like the 15-minute chart, a higher sensitivity might be more appropriate.
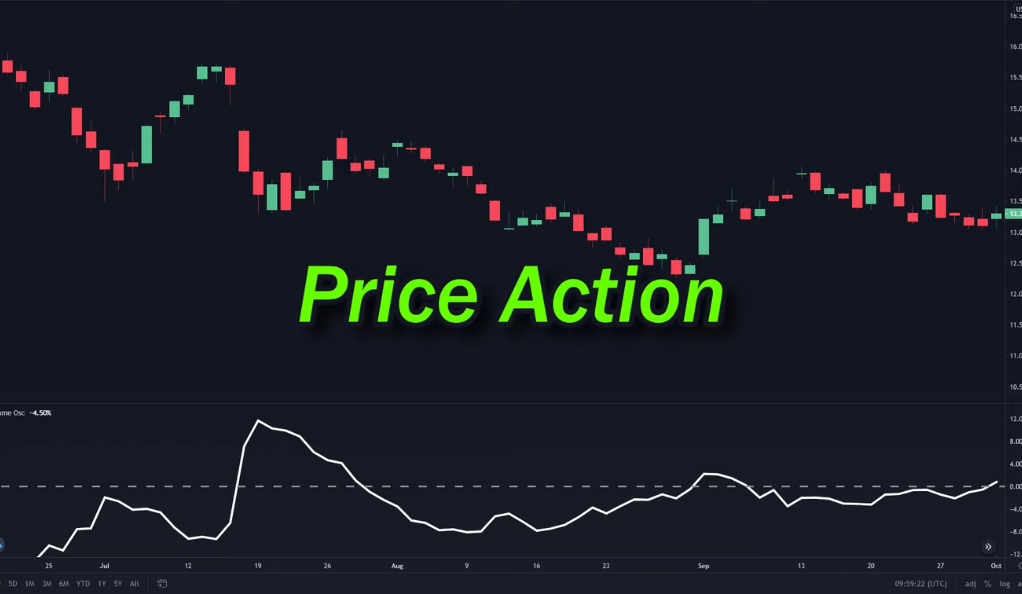
Combining Volume with Price Action
Now, let’s talk strategy. Combining volume analysis with price action can lead to effective trading. It’s like combining the rhythm and melody in a song – both elements work together to create a harmonious tune.
For instance, if the price breaks out of a range while volume increases, it indicates a strong trend in the direction of the breakout. It’s like a sprinter bursting out of the blocks at the start of a race. Similarly, if a bullish pattern forms at a key support level with increasing volume, it’s a good opportunity to buy. It’s like spotting a rising star in the sky, signaling a clear night ahead.
Bonus Strategies
Beyond the basics and advanced concepts, there are bonus strategies in stock trading. These include swing trading, contrarian investing, momentum trading, and options trading. These strategies provide additional tools and techniques for traders to navigate the market and potentially generate profits in different conditions.
Bonus Strategy: The Money Flow Index
As a bonus strategy, let’s introduce the Money Flow Index (MFI), another volume indicator. The MFI is like a thermometer for the market. When the line crosses above the high line, the price is considered overbought and likely to reverse downwards. It’s like a fever breaking, signaling a potential return to normal. Conversely, if the line crosses below the low line, the price is considered oversold and likely to reverse upwards. It’s like a cold snap ending, signaling a potential warming trend.
However, this indicator should not be used in isolation. It’s like trying to predict the weather based solely on temperature. Other factors, like support and resistance, should also be taken into account.
Conclusion
In conclusion, understanding and using volume in stock trading can be a game-changer. It’s like having a secret weapon in your trading arsenal. By understanding market movers, differentiating between stock and forex markets, using the volume oscillator, combining volume with price action, and utilizing the Money Flow Index, you can maximize your profits and navigate the stock market with confidence. Remember, in the world of trading, knowledge is power. And understanding volume gives you that power.
Ainu Token aims to offer impartial and trustworthy information on cryptocurrency, finance, trading, and shares. However, we don't provide financial advice and recommend users to conduct their own studies and thorough checks.
Comments (No)