In the fast-paced world of trading, having a reliable strategy is paramount to success. One such strategy that has garnered attention and proven effective is the Pullback Trading Strategy. This strategy allows traders to capitalize on temporary price reversals within an overall trend. By understanding the dynamics of pullbacks and employing specific techniques, traders can identify opportune moments to enter trades with reduced risk. In this comprehensive guide, we will delve into the intricacies of the Pullback Trading Strategy and explore various aspects that contribute to its effectiveness.
Pullbacks are natural occurrences within financial markets, characterized by temporary price reversals against the prevailing trend. Just like waves in the ocean, market trends ebb and flow, creating opportunities for traders. During an uptrend, pullbacks represent temporary pauses or corrections before the price continues its upward trajectory. Conversely, in a downtrend, pullbacks provide brief relief before the price resumes its downward movement. Understanding pullbacks is essential because they offer advantageous entry points into trades, allowing traders to buy or sell at more favorable prices. By mastering the art of identifying and trading pullbacks, traders can enhance their profitability and navigate the markets with increased confidence.
Contents
- 1 Understanding the Basics: What is a Pullback?
- 2 The Importance of Pullbacks in Trading
- 3 Identifying the End of a Pullback
- 4 High Confluence Areas: The Intersection of Levels
- 5 Confirmation Techniques: Ensuring the Pullback is Not a Downward Continuation
- 6 The Role of the RSI Indicator in Confirmation
- 7 Mastering Multiple Confirmation Techniques: A Trader’s Arsenal
- 8 Avoiding False Signals: The Importance of Prudence
- 9 Conclusion
Understanding the Basics: What is a Pullback?
To fully comprehend the Pullback Trading Strategy, it is crucial to grasp the fundamentals of pullbacks. A pullback, often referred to as a retracement or correction, is a temporary reversal in the price of an asset within the context of an established trend. It is important to note that pullbacks are normal occurrences and should not be confused with trend reversals. While they may induce uncertainty or doubt, they are integral components of trending markets.
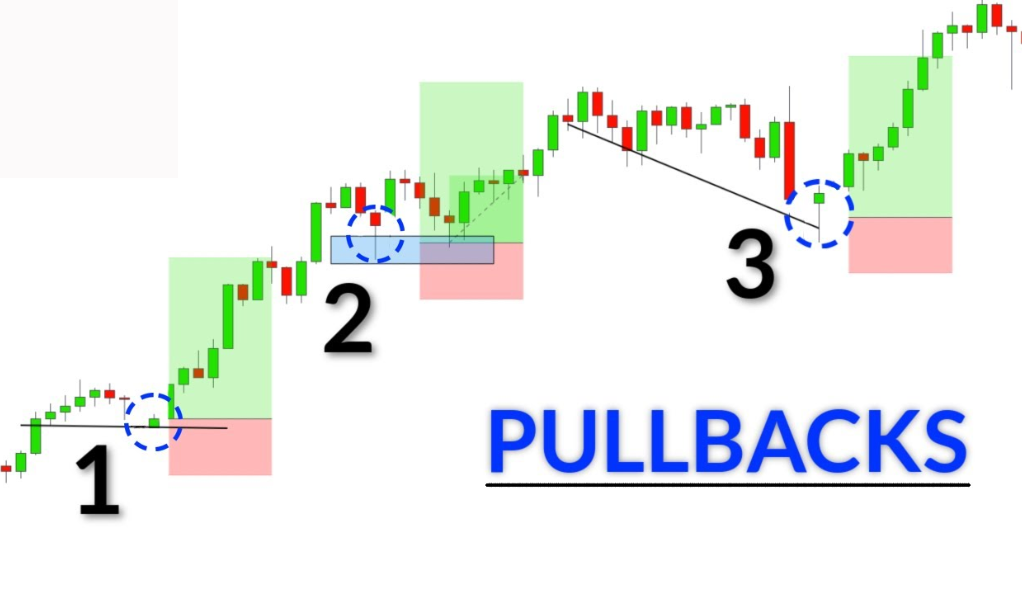
Pullbacks can be visualized as temporary pauses or breathers in the ongoing trend. They serve to alleviate the momentum of the prevailing trend, creating an opportunity for market participants to reassess their positions. During an uptrend, pullbacks manifest as declines or retracements in price, allowing buyers to enter at more favorable levels. Conversely, in a downtrend, pullbacks present temporary rallies or upward movements before the downtrend resumes.
By understanding the nature of pullbacks, traders can position themselves strategically within the market. Rather than perceiving pullbacks as obstacles or threats, astute traders view them as opportunities to join the prevailing trend at more advantageous prices. The Pullback Trading Strategy leverages this concept by enabling traders to identify optimal entry points and ride the wave of the overall trend.
The Importance of Pullbacks in Trading
Pullbacks play a significant role in trading as they provide valuable insights into market dynamics and offer traders unique opportunities. Here are a few key reasons why pullbacks are important:
1. Price Confirmation: Pullbacks act as a form of price confirmation within an established trend. When a pullback occurs, it validates the strength and sustainability of the trend. If the price quickly resumes its movement in the direction of the trend after a pullback, it reaffirms the market’s conviction in the prevailing trend. This confirmation helps traders gain confidence in their trading decisions and reduces the likelihood of entering trades prematurely.
2. Improved Risk-Reward Ratio: Pullbacks allow traders to enter trades at more favorable prices, improving the risk-reward ratio. By patiently waiting for pullbacks, traders can position themselves closer to support levels in an uptrend or resistance levels in a downtrend. This positions them with tighter stop-loss levels and potentially larger profit targets, enhancing their overall risk-reward ratio. Pullbacks provide an opportunity to buy low in an uptrend or sell high in a downtrend, increasing the potential profitability of trades.
3. Increased Trading Opportunities: Trading pullbacks opens up a broader range of opportunities for traders. Instead of solely focusing on entering trades at the beginning of a trend, traders can actively seek out pullbacks within the trend. This allows them to capitalize on short-term price movements while still aligning with the overall trend. Pullbacks provide additional entry points and flexibility, allowing traders to adapt to evolving market conditions and capture more trading opportunities.
4. Psychological Benefits: Pullbacks can have a positive psychological impact on traders. During a strong trend, it is common for traders to experience fear of missing out (FOMO) if they haven’t entered a position early. However, pullbacks provide a chance to enter trades at more favorable prices, alleviating the fear of missing out. Traders can approach the market with a more patient and disciplined mindset, knowing that pullbacks offer them opportunities to participate in the trend without the stress of chasing prices.
By recognizing the importance of pullbacks and incorporating them into their trading strategies, traders can take advantage of these temporary price reversals to enhance their decision-making process, improve risk management, and increase their chances of successful trades. Pullbacks serve as a valuable tool in the trader’s toolbox, providing insights into market dynamics and offering enhanced trading opportunities.
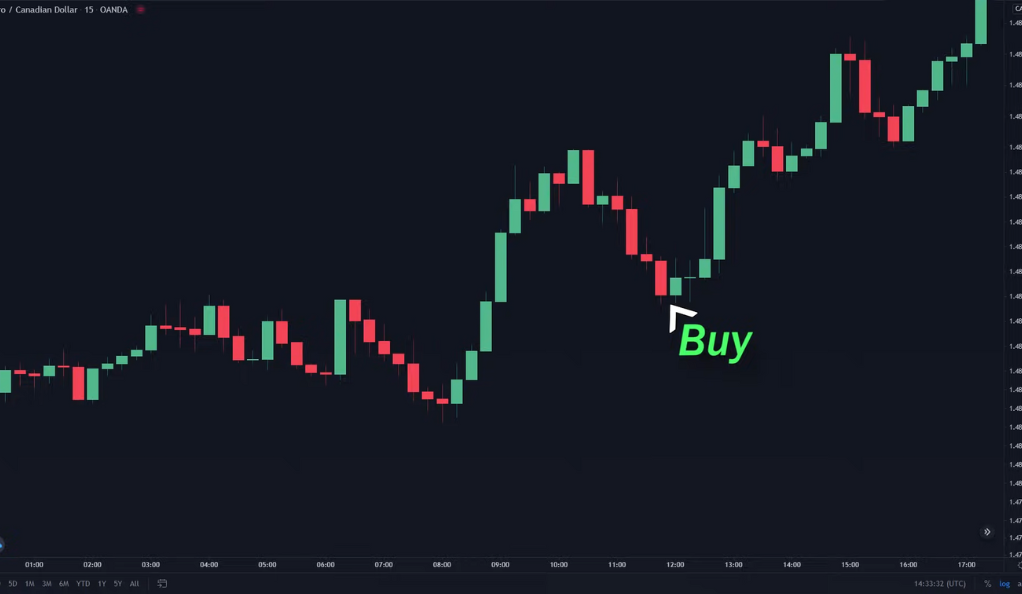
Identifying the End of a Pullback
To effectively trade pullbacks, it is crucial to accurately identify the end of a pullback and seize the optimal entry point. Several key levels and indicators can help traders determine when a pullback is likely to conclude. Let’s explore these levels in more detail:
1. Support and Resistance Levels
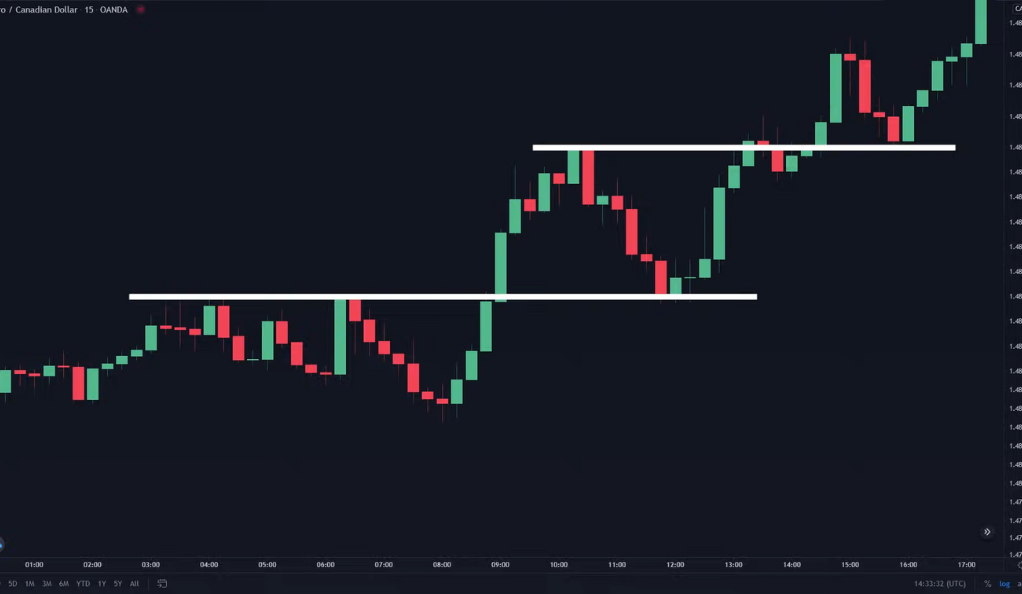
Support and resistance levels are critical areas on a price chart that act as barriers to price movement. During a pullback, these levels play a significant role in determining potential reversal points. In an uptrend, a pullback is expected to find support at previous resistance-turned-support levels. Conversely, in a downtrend, a pullback may encounter resistance at prior support-turned-resistance levels. By identifying these key levels and monitoring how price behaves near them, traders can gauge the end of a pullback and make informed trading decisions.
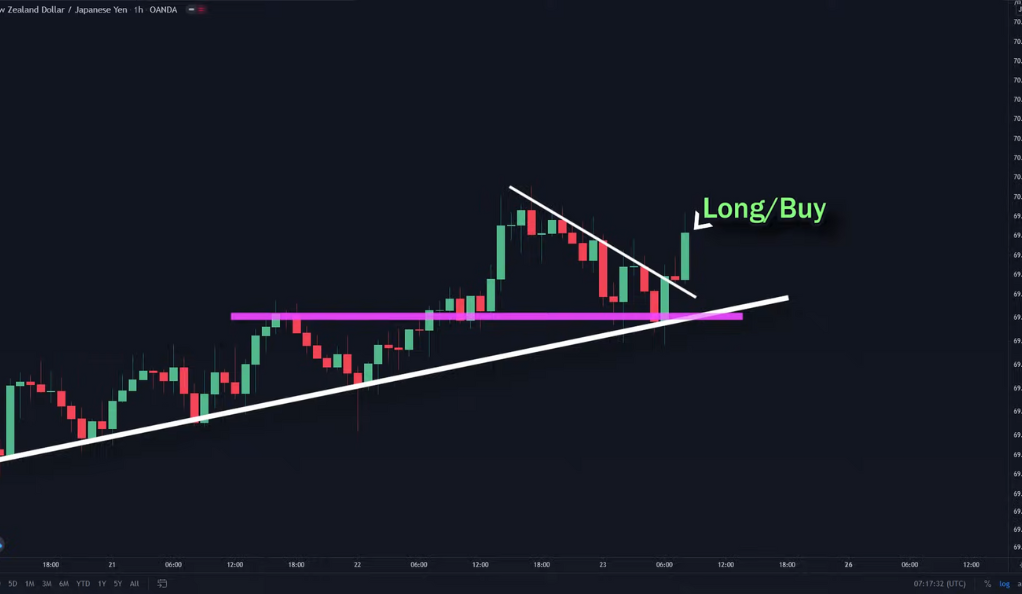
2. Trend Lines
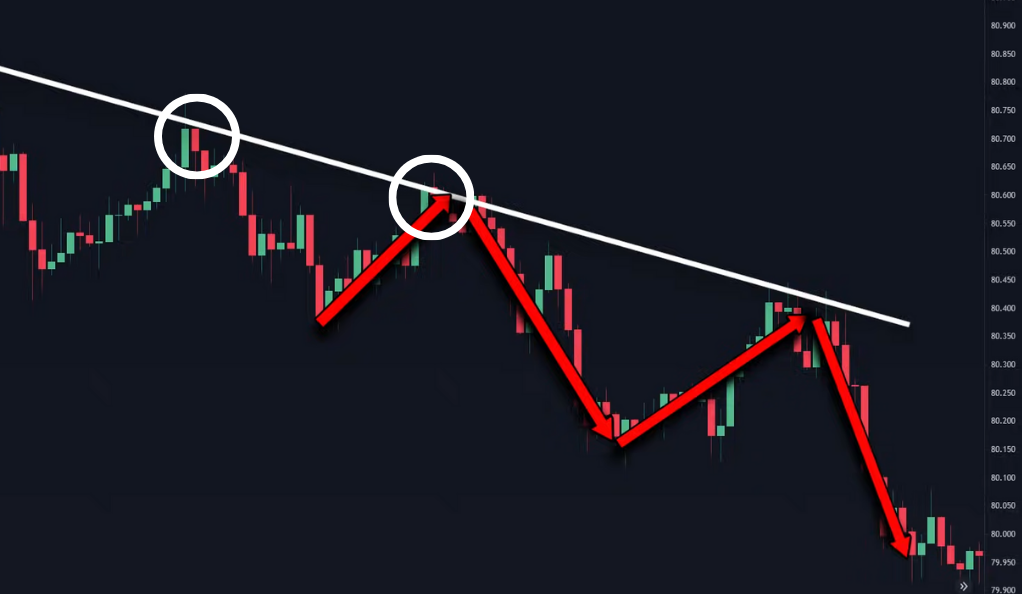
Trend lines are invaluable tools for understanding market trends and identifying potential pullback reversal points. In an uptrend, an ascending trend line is drawn by connecting higher swing lows. When a pullback reaches this trend line and shows signs of price rejection or bullish candlestick patterns, it may indicate the end of the pullback. Similarly, in a downtrend, a descending trend line connecting lower swing highs can signal a potential reversal when price reaches the trend line and exhibits bearish price action.
3. Moving Averages
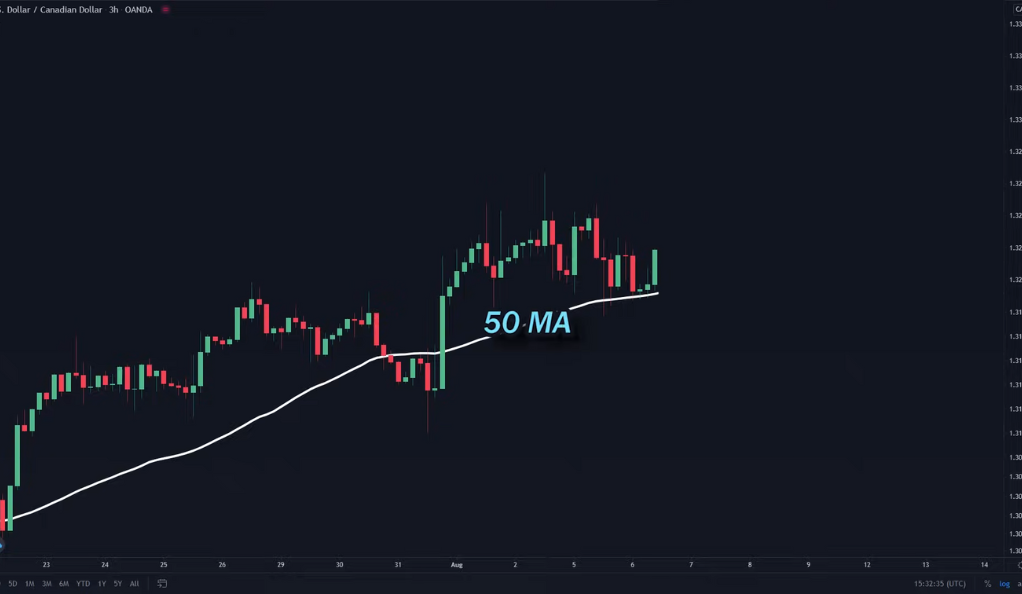
Moving averages are widely used by traders to identify trend directions and potential support or resistance areas. During a pullback, price often finds temporary support or resistance near specific moving averages. The 50-period moving average is commonly employed, but other periods such as the 20, 100, or 200 can also be utilized based on market preferences. When price approaches a moving average during a pullback and demonstrates a bounce or rejection, it suggests a potential end to the pullback.
4. Oscillators and Indicators
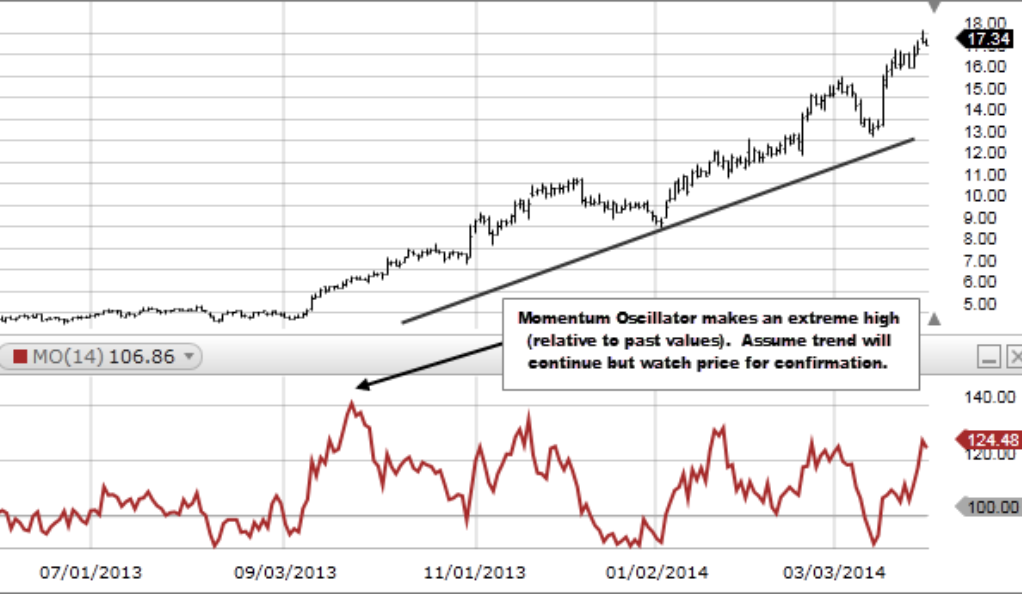
In addition to price levels and trend lines, traders can employ oscillators and indicators to validate the end of a pullback. Oscillators such as the Relative Strength Index (RSI) or the Stochastic Oscillator help assess whether a market is overbought or oversold. When these indicators reach extreme levels and start to reverse their direction, it may indicate the conclusion of a pullback and the potential resumption of the prevailing trend.
By combining multiple techniques and using a systematic approach, traders can increase their confidence in identifying the end of a pullback. It is important to note that no single indicator or level guarantees the accuracy of timing the end of a pullback. Therefore, it is advisable to employ a holistic analysis approach and consider the confluence of multiple factors before entering trades based on pullbacks.
High Confluence Areas: The Intersection of Levels
When multiple key levels or indicators align at a specific point on the price chart, it creates what traders refer to as a high confluence area. These areas provide a powerful signal for potential trend reversals or resumptions. The convergence of different levels increases the probability of a significant price reaction, making high confluence areas highly desirable for traders seeking optimal entry points.
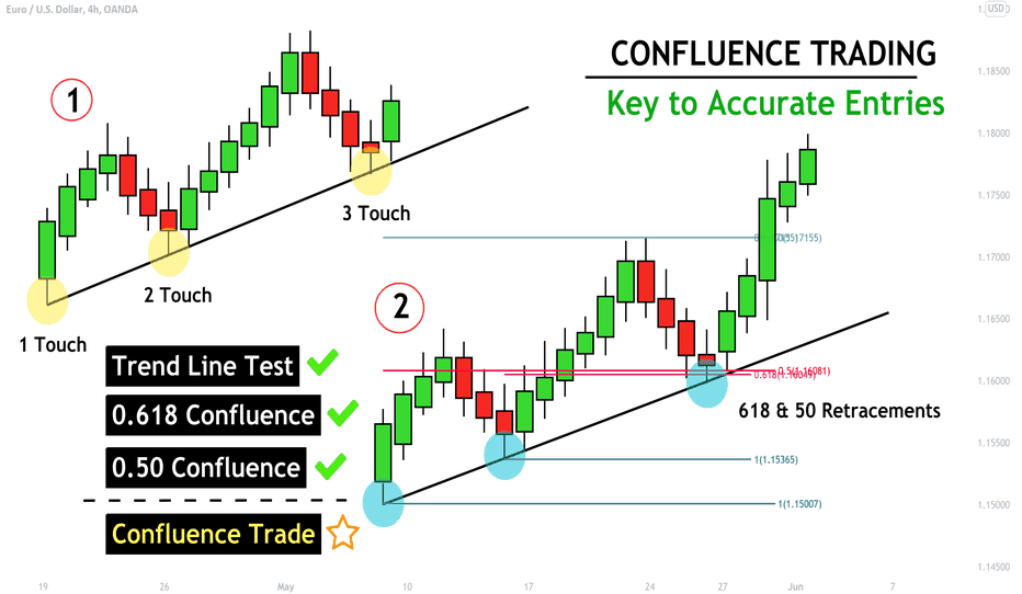
For example, imagine a high confluence area where a pullback reaches a significant support level, coinciding with a trendline and a key moving average. This combination of multiple factors strengthens the potential for a reversal, as it demonstrates a collective alignment of support and resistance levels. The more factors that intersect at a specific point, the stronger the confluence and the greater the likelihood of a meaningful price reaction.
When identifying high confluence areas, traders should focus on areas where support and resistance levels coincide with trend lines, moving averages, or other technical indicators. By recognizing these areas, traders can place more emphasis on potential trade setups that occur within them, as they offer a higher probability of success.
It’s important to exercise caution and not rely solely on high confluence areas. While they provide valuable signals, they are not foolproof and should be used in conjunction with other aspects of technical analysis and risk management techniques. Combining high confluence areas with confirmation techniques, such as candlestick patterns or oscillator signals, can further enhance the probability of successful trades.
By being patient and waiting for high confluence areas to align with their trading strategies, traders can increase their chances of entering trades with favorable risk-reward ratios and higher potential for profitable outcomes.
Confirmation Techniques: Ensuring the Pullback is Not a Downward Continuation
Now, you might be thinking, “Great, I’ve identified a pullback and found a high confluence area. I’m ready to enter a position!” But hold your horses! It’s not time to jump in just yet. We need to ensure that the pullback is indeed a pullback and not a continuation of a downward trend. This is where confirmation techniques come into play. Let’s explore two of these techniques.
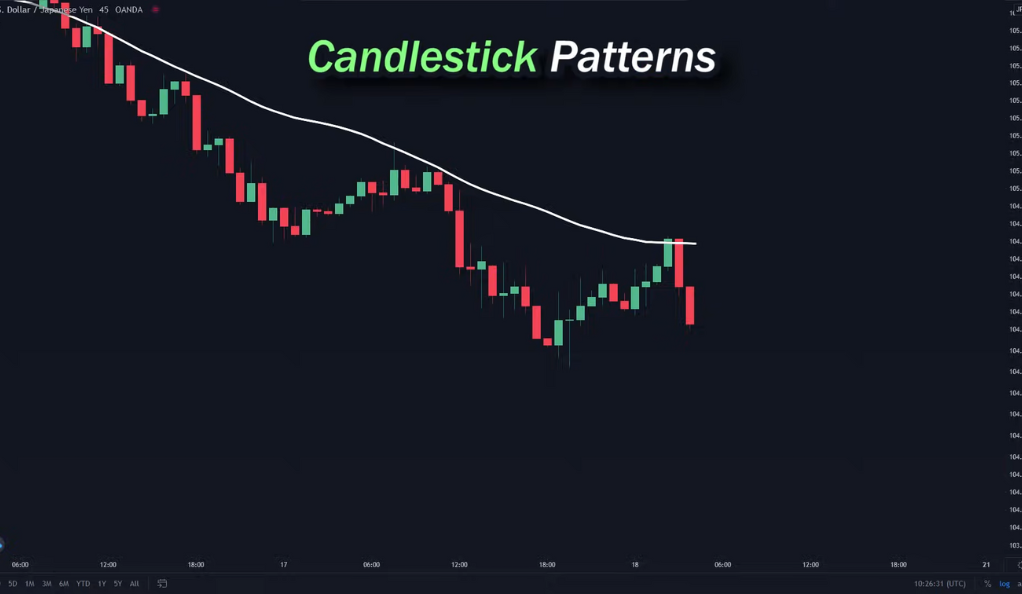
- 1. Candlestick Patterns
Candlestick patterns are like the secret language of the market. They can tell us a lot about market sentiment and potential reversals. For example, a bearish engulfing pattern in a downtrend can indicate strong selling pressure, suggesting a good opportunity for a short position. On the other hand, a bullish engulfing pattern in an uptrend can signal strong buying pressure, indicating a potential long position.
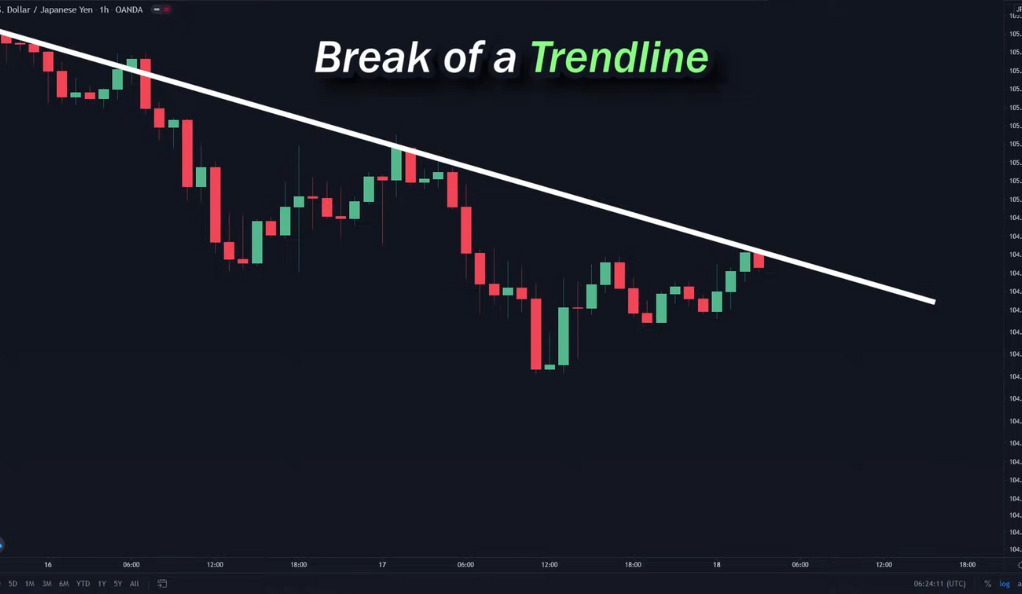
- 2. Break of a Trendline
Another technique involves the use of trendlines. But this time, we’re not just observing them; we’re actively using them to confirm our entry point. This technique involves drawing a smaller trendline at the pullback and entering a position when the price breaks out of this smaller trendline. It’s like waiting for a runner to cross the finish line before declaring them the winner.
The Role of the RSI Indicator in Confirmation
The Relative Strength Index (RSI) is another tool you can use for confirmation. By setting the RSI to a single line in the middle, you can enter a position when the RSI crosses above (for a long entry) or below (for a short entry) this middle line. It’s like using a thermometer to confirm if someone has a fever or not.
Mastering Multiple Confirmation Techniques: A Trader’s Arsenal
As a trader, it’s essential to have a diverse set of tools in your arsenal. Relying on a single strategy or confirmation technique may limit your potential opportunities. By mastering multiple confirmation techniques, you can adapt to different market conditions and avoid missing out on trade opportunities.
Avoiding False Signals: The Importance of Prudence
While confirmation techniques can enhance your decision-making process, it’s crucial to exercise prudence and avoid blindly entering a position based solely on a single signal. Markets can be unpredictable, and prices can break through levels and continue in the opposite direction. Therefore, it’s essential to use additional confirmation techniques and consider the overall market context before making a trading decision.
Conclusion
In conclusion, the Pullback Trading Strategy offers traders an effective approach to capitalize on temporary market reversals. By understanding the basics of pullbacks and identifying key levels such as support and resistance, trend lines, and moving averages, traders can locate potential entry points with reduced risk. Moreover, by incorporating confirmation techniques like candlestick patterns, trendline breaks, and the RSI indicator, traders can increase their confidence in their trading decisions.
It’s important to note that trading involves inherent risks, and no strategy guarantees success. Therefore, it’s advisable to practice risk management techniques, conduct thorough analysis, and continuously educate oneself in the dynamic field of trading. With a well-rounded approach and the ability to adapt to changing market conditions, traders can enhance their trading performance and strive for consistent profitability.
Remember, the world of trading is ever-evolving, and mastering the Pullback Trading Strategy is just one piece of the puzzle. Continual learning, experience, and adaptability are key to navigating the exciting and challenging landscape of financial markets.
Ainu Token aims to offer impartial and trustworthy information on cryptocurrency, finance, trading, and shares. However, we don't provide financial advice and recommend users to conduct their own studies and thorough checks.
Comments (No)