In the vast and volatile world of trading, having a robust and reliable strategy is not just an advantage, it’s a necessity. Strategies are as diverse as the traders themselves, with some thriving on the adrenaline rush of day trading, while others prefer the slow and steady approach of long-term investing. Regardless of your trading style, one thing remains constant: the need for reliable indicators. Today, we’ll delve into a unique trading strategy that leverages the power of two specific indicators: UT Bot Alerts and Shaft Trend Circle (STC). This strategy has shown promise in backtesting, but as always, it’s essential to do your own research and consider your risk tolerance before diving in.
Understanding the Indicators
It is crucial in this trading strategy. The UT Bot Alerts and Shaft Trend Circle (STC) indicators serve as the backbone of this approach. The former provides buy and sell signals, while the latter offers trend insights. Mastering these indicators’ settings and interpretations is key to identifying potential trading opportunities and making informed decisions.
UT Bot Alerts
It is a dynamic indicator that plays a pivotal role in this trading strategy. It’s designed to provide traders with buy and sell signals, which can guide decision-making and help pinpoint potential trading opportunities.
The UT Bot Alerts indicator works by analyzing specific market conditions and generating signals when these conditions meet certain criteria. These signals can help traders identify when it might be a good time to enter or exit a trade, based on the anticipated direction of the market.
In this particular strategy, the UT Bot Alerts indicator is used in a unique way: it’s applied twice, each time with different settings to generate buy and sell signals. This dual application allows the indicator to serve a dual purpose, providing guidance on both ends of the trade.
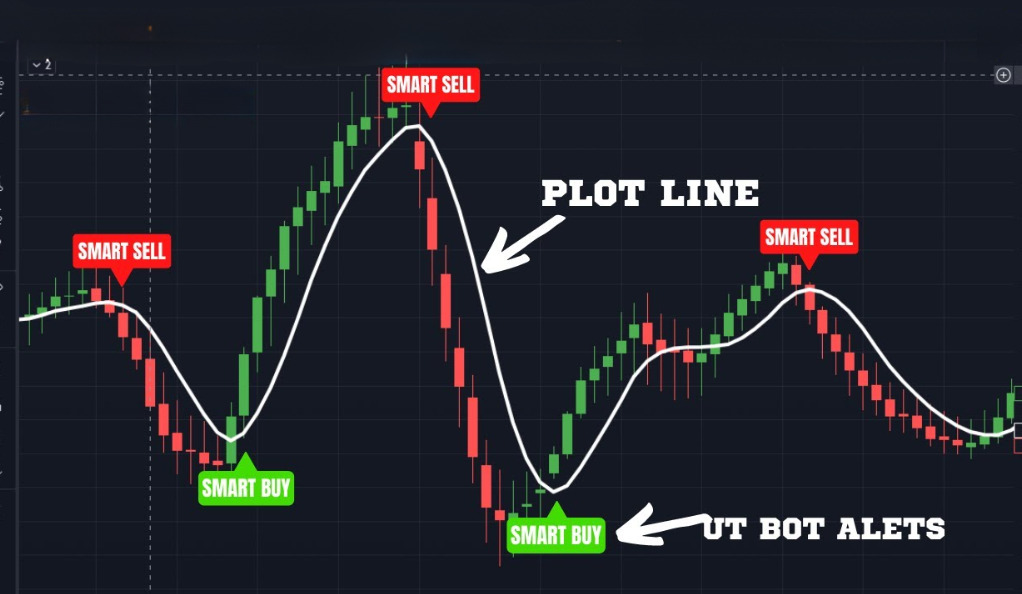
UT Bot Alerts for Sell Signals
For sell signals, the UT Bot Alerts indicator is set with a key value of 2 and an ATR (Average True Range) period of 1. The ATR is a technical analysis indicator that measures market volatility by decomposing the entire range of an asset price for that period. This configuration helps identify potential selling opportunities in the market when the price is expected to go down.
UT Bot Alerts for Buy Signals
For buy signals, the key value is set at 2. This key value is a parameter within the UT Bot Alerts indicator that helps determine the sensitivity of the buy signals. A key value of 2 means that the indicator will generate a buy signal when it identifies a strong potential for an upward price movement.
The ATR (Average True Range) period is another important setting for the buy signals. In this strategy, the ATR period is set to 300. The ATR is a volatility indicator that measures the degree of price volatility. By setting the ATR period to 300, the indicator takes into account a larger period of price data, which can help smooth out short-term fluctuations and provide a more accurate picture of the market’s overall trend.
Setting Up UT Bot Alerts on TradingView
UT Bot Alerts is a powerful tool designed to enhance your trading experience on TradingView. It provides real-time alerts based on specific market conditions, helping traders make informed decisions. Whether you’re a beginner or an experienced trader, UT Bot Alerts can be a valuable addition to your trading toolkit.
Getting Started
- UT Bot Alerts is a script on TradingView.
- It sends alerts for potential trading opportunities.
- Aimed at helping traders respond quickly to market changes.
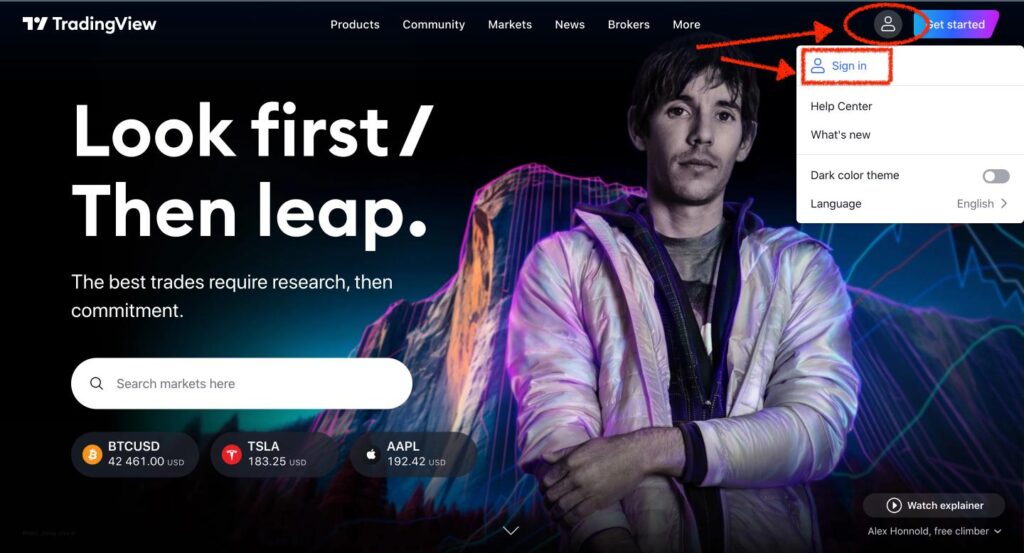
Creating a TradingView Account
- If you don’t have a TradingView account, you’ll need to create one.
- Visit TradingView’s website.
- Click on ‘Sign Up’ and fill in the required details.
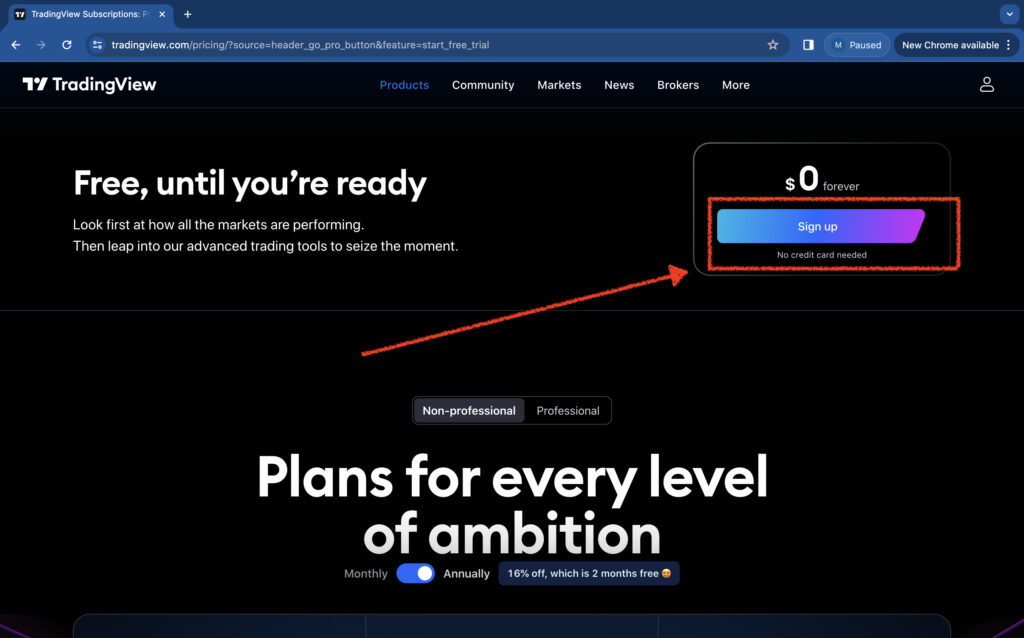
- Verify your account through the email sent to you.
- Once your account is set up, you can access various trading tools, including UT Bot Alerts.
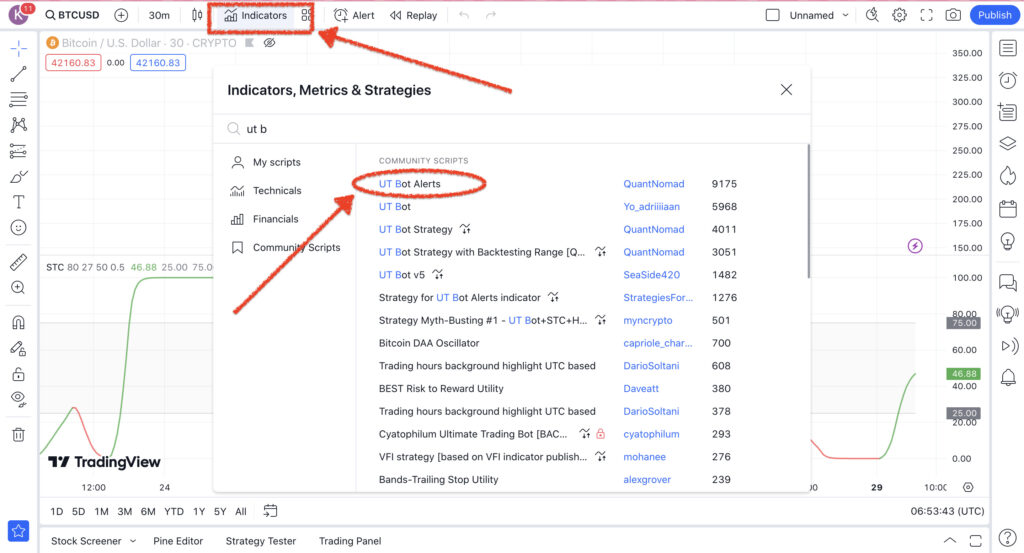
Finding UT Bot Alerts on TradingView
To find the UT Bot Alerts on TradingView, you can follow these steps:
- Access TradingView: First, you need to have an account on TradingView. Visit the TradingView website and log in. If you don’t have an account, you can create one.
- Search for UT Bot Alerts: On the TradingView platform, there’s a search bar at the top. You can type “UT Bot Alerts” or the name of the creator (like “QuantNomad”) into this search bar.
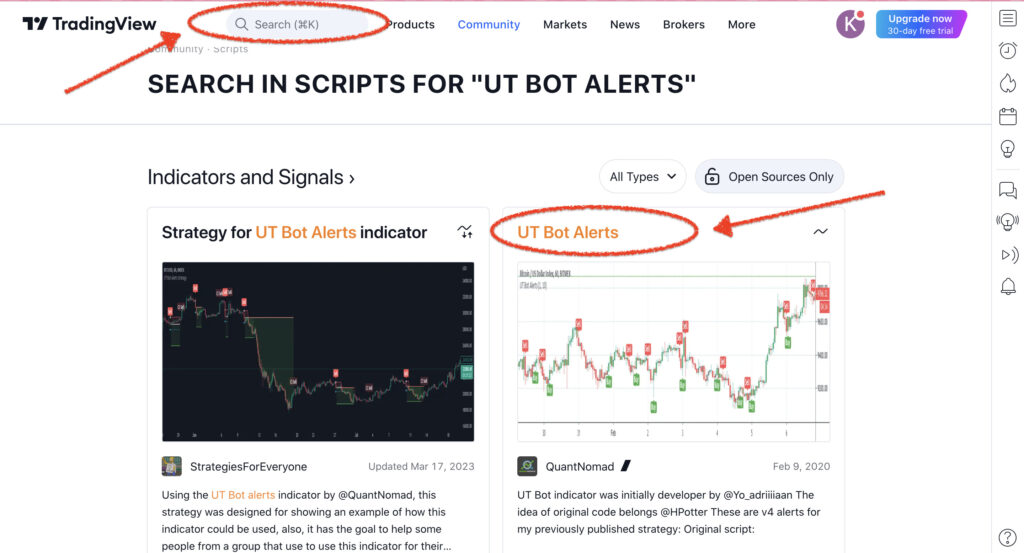
- Access and Apply the Indicator: After finding the UT Bot Alerts indicator, you can view its details and apply it to a chart. To do this, open a chart of your choice and look for the option to add an indicator or script. Search for “UT Bot Alerts” in the indicators list and add it to your chart.
- Customize the Indicator: The UT Bot Alerts indicator might have customizable settings that you can adjust according to your trading strategy. These settings are usually accessible through the indicator’s settings icon on your chart.
- Additional Resources: If you’re looking for more detailed guidance or tutorials on how to use the UT Bot Alerts, consider visiting Quant Nomad’s website or his profile on TradingView. They may offer additional insights, educational content, and resources.
Remember, while tools like UT Bot Alerts can be valuable for trading analysis, they are not foolproof and should be used as part of a comprehensive trading strategy and risk management approach.
In this article, we’ve included the Pine Script code for UT Bot Alerts, compatible with TradingView’s scripting language. This script provides valuable trading signals by analyzing market trends with its unique algorithm. Here’s the script for your reference:
//@version=4
study(title="UT Bot Alerts", overlay = true)

// Inputs
a = input(1,     title = "Key Vaule. 'This changes the sensitivity'")
c = input(10,    title = "ATR Period")
h = input(false, title = "Signals from Heikin Ashi Candles")

xATR  = atr(c)
nLoss = a * xATR

src = h ? security(heikinashi(syminfo.tickerid), timeframe.period, close, lookahead = false) : close

xATRTrailingStop = 0.0
xATRTrailingStop := iff(src > nz(xATRTrailingStop[1], 0) and src[1] > nz(xATRTrailingStop[1], 0), max(nz(xATRTrailingStop[1]), src - nLoss),
   iff(src < nz(xATRTrailingStop[1], 0) and src[1] < nz(xATRTrailingStop[1], 0), min(nz(xATRTrailingStop[1]), src + nLoss),
   iff(src > nz(xATRTrailingStop[1], 0), src - nLoss, src + nLoss)))

pos = 0
pos :=	iff(src[1] < nz(xATRTrailingStop[1], 0) and src > nz(xATRTrailingStop[1], 0), 1,
   iff(src[1] > nz(xATRTrailingStop[1], 0) and src < nz(xATRTrailingStop[1], 0), -1, nz(pos[1], 0)))

xcolor = pos == -1 ? color.red: pos == 1 ? color.green : color.blue

ema   = ema(src,1)
above = crossover(ema, xATRTrailingStop)
below = crossover(xATRTrailingStop, ema)

buy  = src > xATRTrailingStop and above
sell = src < xATRTrailingStop and below

barbuy  = src > xATRTrailingStop
barsell = src < xATRTrailingStop

plotshape(buy,  title = "Buy",  text = 'Buy',  style = shape.labelup,   location = location.belowbar, color= color.green, textcolor = color.white, transp = 0, size = size.tiny)
plotshape(sell, title = "Sell", text = 'Sell', style = shape.labeldown, location = location.abovebar, color= color.red,   textcolor = color.white, transp = 0, size = size.tiny)

barcolor(barbuy  ? color.green : na)
barcolor(barsell ? color.red   : na)

alertcondition(buy,  "UT Long",  "UT Long")
alertcondition(sell, "UT Short", "UT Short")
Note: Please ensure you are using the most current version of the code for accurate and efficient performance. The world of trading is dynamic, and scripts like these are regularly updated to adapt to market changes. To verify you have the latest update of the UT Bot Alerts script, visit the official link on TradingView: UT Bot Alerts on TradingView. This will ensure that you are working with the most recent and optimized version of the tool, enhancing your trading strategy’s effectiveness.
Step-by-Step Guide to Adjusting the Settings
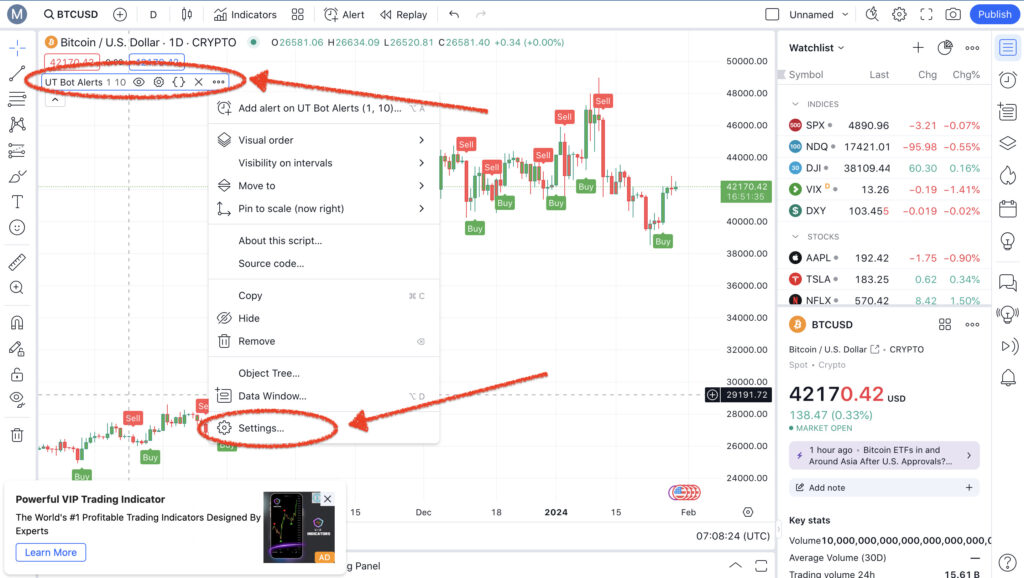
- Access Script Settings: Click on the gear icon next to the UT Bot Alerts in your TradingView chart to open the settings panel.
- Sensitivity Settings: Adjust the sensitivity level. Higher sensitivity could catch more market movements but may lead to false signals. Lower sensitivity might provide more accurate alerts but could miss some opportunities.
- Selecting Time Frames: Choose the time frame that aligns with your trading strategy. This could range from short (like 1-minute charts) to long (like daily charts).
- Alert Conditions Setup: Define the conditions for alerts. This could be based on price action, volume, or a combination of various indicators.
- Thresholds and Limits: Set thresholds for when you receive alerts, like specific price points or percentage changes.
- Visual Settings: Customize how the alerts appear on your chart, like color coding for different types of signals.
- Testing and Tweaking: After adjusting the settings, observe how the script performs. You might need to tweak settings based on the script’s performance and market conditions.
- Save Settings: Once you’re satisfied with the adjustments, save your settings to apply them to your chart.
Understanding the Interface
- The interface typically includes a control panel for settings.
- Look for visual cues on the chart, like colored lines or markers, which represent the script’s analysis.
- Explore additional features, such as historical data analysis or integration with other indicators, to gain more insights.
- Regularly update the script to ensure you have the latest features and improvements.
Utilizing UT Bot Alerts for Effective Trading
Using UT Bot Alerts effectively can significantly enhance your trading strategy on TradingView. This tool provides timely signals that can guide your trading decisions, but understanding and interpreting these signals correctly is key to success.
Reading the Alerts
- Signal Interpretation: Each alert, whether buy or sell, indicates a potential market movement. A buy signal doesn’t just mean ‘buy immediately’; it suggests that the market conditions may be turning favorable for a long position. Similarly, a sell signal hints at a potential decline, indicating a possible short-selling opportunity or a signal to exit a long position.
- Timing and Execution: The timing of acting on these signals is crucial. Immediate action isn’t always advised. Watch for market confirmation or a secondary indicator to align with the UT Bot Alert signal for stronger assurance.
- Market Conditions: Consider the overall market conditions and trends. For instance, a buy signal during a strong downtrend may require more scrutiny. Signals are more reliable when they match the broader market trend.
- Additional Indicators: Supplement UT Bot Alerts with other technical analysis tools such as moving averages, RSI, or MACD. This multi-indicator approach can help in confirming the signals and reducing false positives.
- Adjusting Alert Settings: Familiarize yourself with the UT Bot Alert settings. Adjust the sensitivity and parameters to match your trading style and risk tolerance. This customization can help in fine-tuning the alerts to your specific needs.
- Risk Management Practices: Always incorporate proper risk management. This includes setting stop-loss orders to limit potential losses and deciding on take-profit levels to secure gains.
- Alert Frequency: Pay attention to the frequency of the alerts. Too frequent alerts might indicate overly sensitive settings, while very rare alerts might mean the settings are too restrictive.
- Historical Performance: Review the historical performance of the alerts. Backtest the signals against historical data to understand how they would have performed in past market conditions.
How To Implement UT Bot Alerts Strategy On eToro
eToro is a popular social trading and investment platform known for its user-friendly interface and diverse trading options, including stocks, cryptocurrencies, and forex. Its unique feature is the social aspect, where users can follow and copy the trades of experienced investors. The UT Bot Alerts strategy, focused on technical indicators for trading decisions, can be effectively implemented on eToro due to its advanced charting tools and real-time data, making it a suitable platform for both novice and experienced traders looking to leverage these alerts.
To manually replicate the UT Bot Alerts strategy on eToro, follow these detailed steps:
Step 1: Set Up the Chart
- Log into eToro: Open your eToro account and log in.
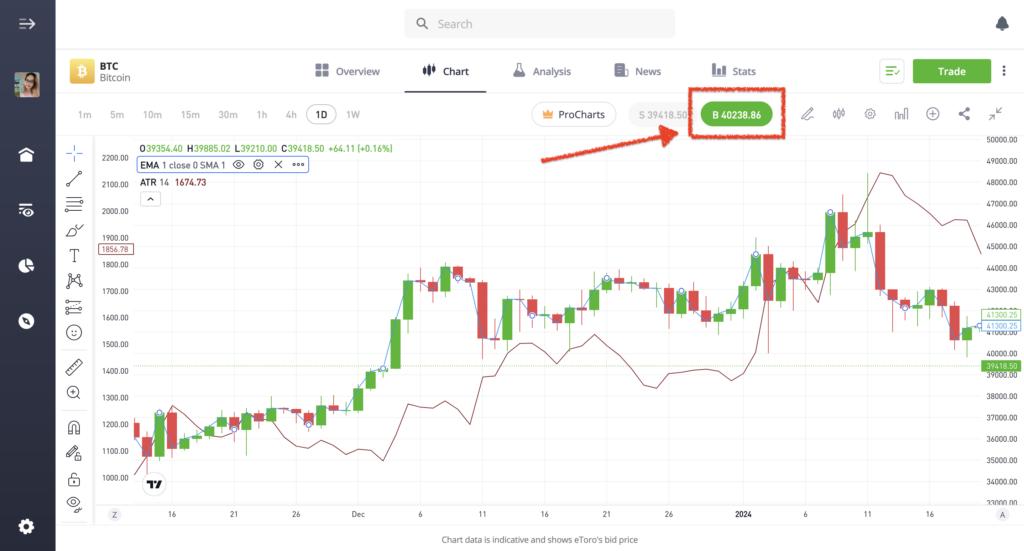
- Select the Asset: Choose the market or asset you want to trade. You can do this by searching for the asset in the search bar.
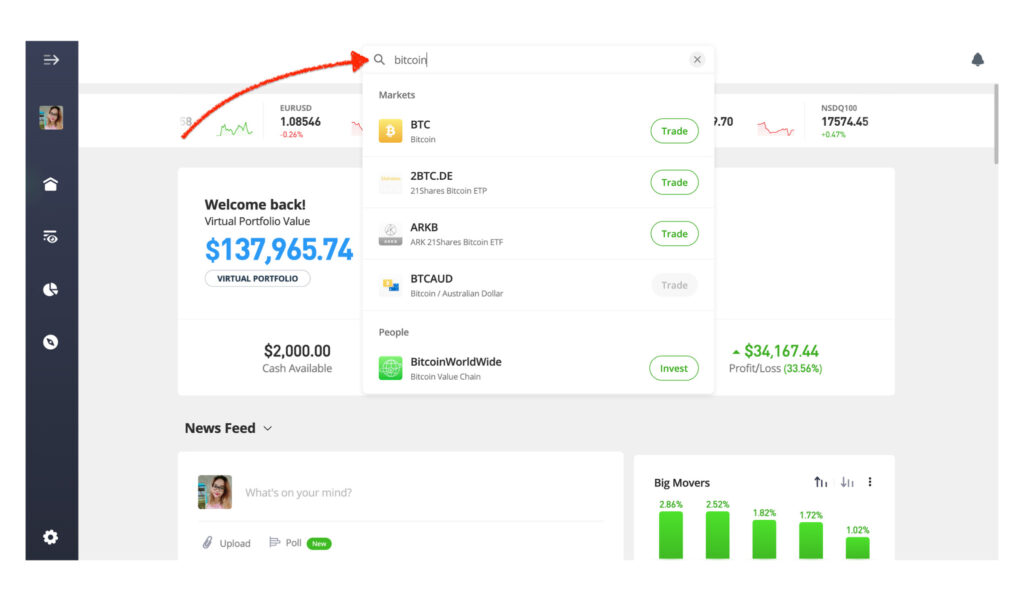
- Open the Chart: Once you’ve selected the asset, open its trading chart. eToro provides a charting tool where you can analyze the price movements of the asset.
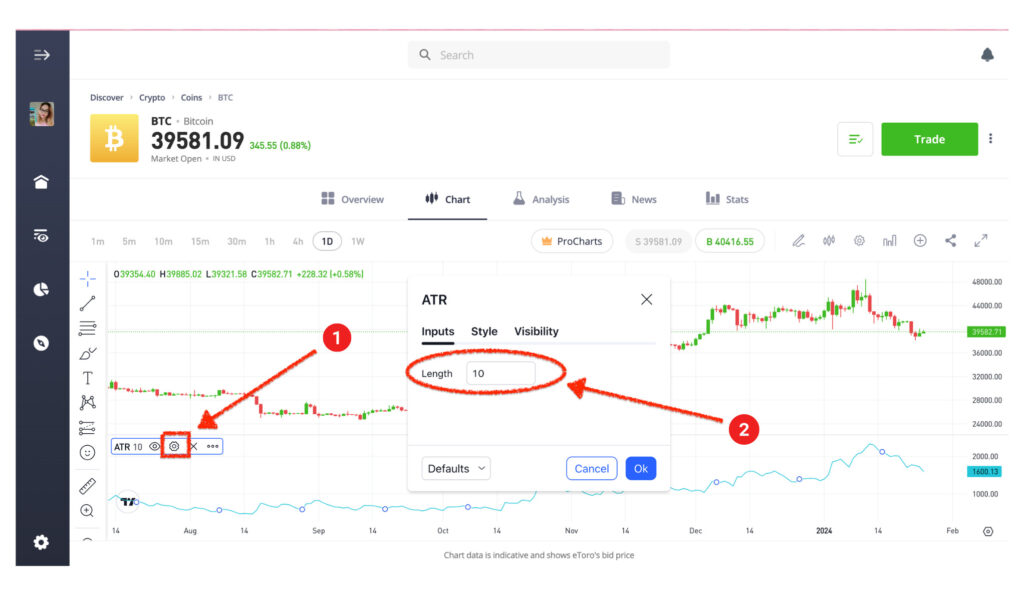
- Add the Average True Range (ATR) Indicator:
- Locate the Indicators Menu: On the chart interface, look for an option to add indicators. This is usually represented by a symbol like a graph.
- Find and Add ATR: In the indicators menu, search for the Average True Range (ATR) indicator and select it. This will add the ATR indicator to your chart.
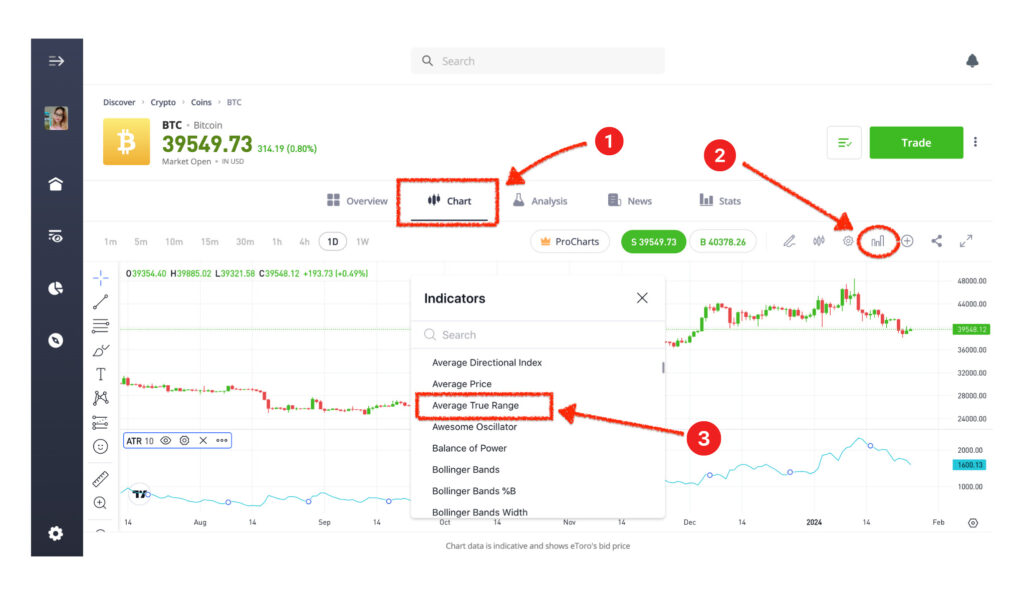
- Configure the ATR Settings:
- Period Setting: Adjust the period setting as per the script’s requirements. For instance, if the script requires a 10-period ATR, set the period to 10. This setting determines over how many periods the ATR is calculated.
- Confirm the Settings: Once you’ve set the period, confirm or apply the settings.
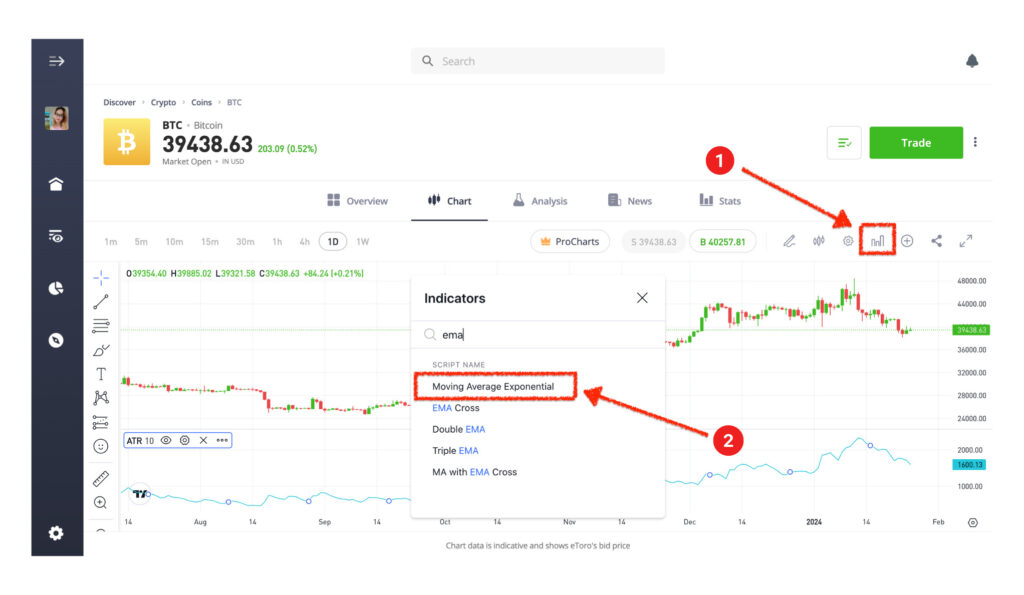
- Add the Exponential Moving Average (EMA) Indicator
- Go Back to the Indicators Menu: Again, access the indicators menu on your chart.
- Find and Add EMA: Look for the Exponential Moving Average (EMA) indicator in the list and add it to your chart.
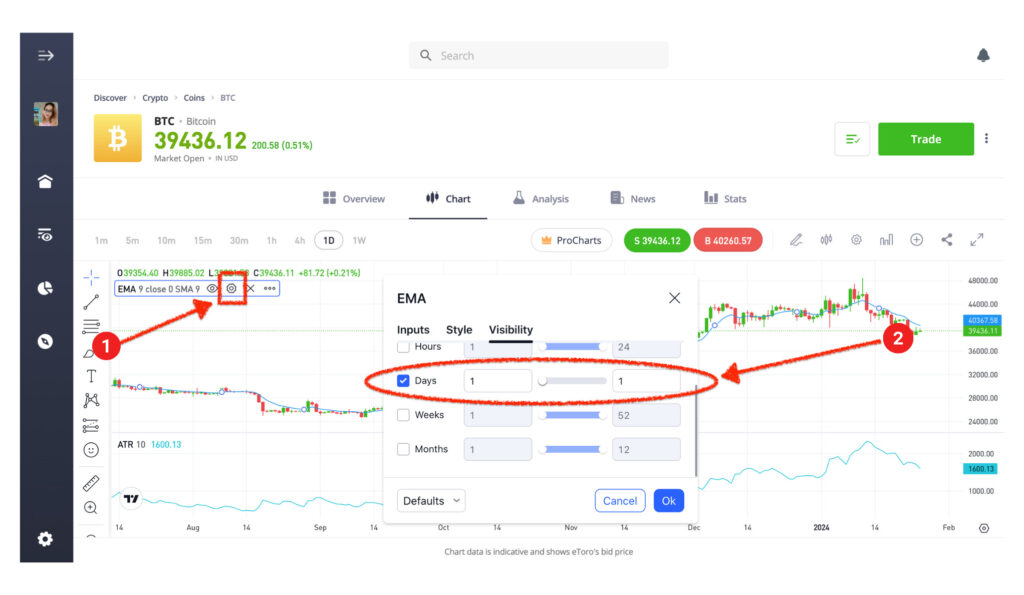
- Configure the EMA Settings:
- Set the Period to 1-Day: The period setting for the EMA should be set to 1 day. This might be represented as ‘1D’ or you might need to set it to ’24 hours’ if the platform uses hourly increments.
- Apply the Setting: Confirm or apply the setting to add the EMA to your chart.
Step 2: Calculate the Trailing Stop
- Determine the ATR Multiplier:
- First, identify the ATR multiplier that your trading strategy or script specifies. This multiplier is a key factor in determining the size of the trailing stop.
- For example, if your script suggests a multiplier of 1, you will use this value in the next step.
- Calculate the Trailing Stop Distance:
- Look at the current value of the ATR on your chart. This value represents the average amount of movement in the price of the asset over the specified number of periods.
- Multiply this ATR value by your ATR multiplier. For instance, if your ATR value is 0.5 and your multiplier is 1, your trailing stop distance would be 0.5 * 1 = 0.5.
- Applying the Trailing Stop Distance:
- For a Long Position: Subtract the calculated trailing stop distance from the current price. For example, if the current price is $10 and your trailing stop distance is $0.5, set the trailing stop at $9.5 ($10 – $0.5).
- For a Short Position: Add the trailing stop distance to the current price. If the current price is $10 and the trailing stop distance is $0.5, set the trailing stop at $10.5 ($10 + $0.5).
By following these steps, you can effectively use the ATR indicator to set a dynamic trailing stop that adjusts to the asset’s volatility, helping to manage risk while allowing room for price movement. Remember, the key is to align this approach with your overall trading strategy and risk management principles.
Step 3: Determine Buy/Sell Signals
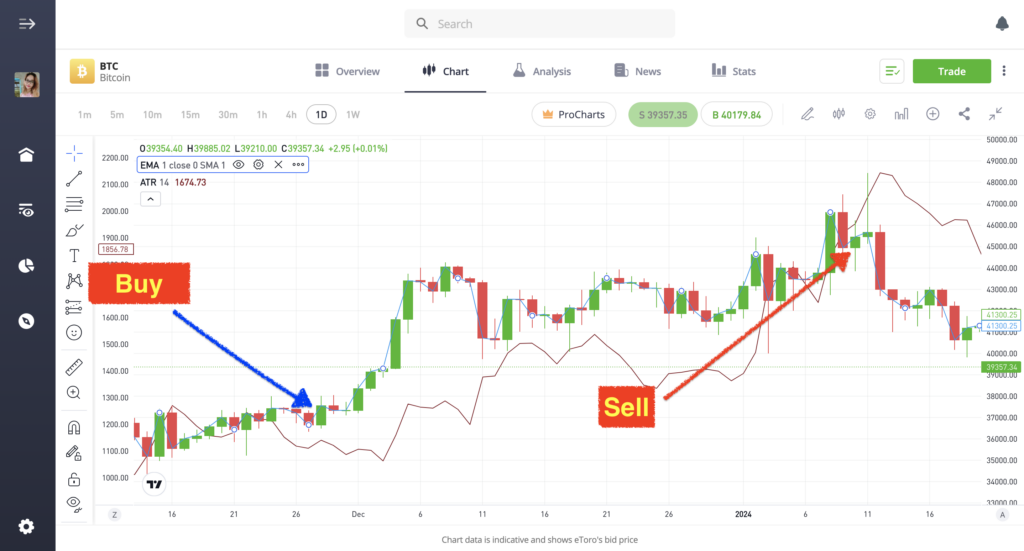
- Observing the Price in Relation to the EMA
- Monitor the Price and EMA Relationship: Regularly check how the current price of the asset compares to the EMA on your chart. The EMA acts as a dynamic benchmark that indicates the ongoing trend.
- Identifying a Buy Signal
- Criteria for a Buy Signal:
- A buy signal is generated when the price of the asset crosses above the EMA. This suggests a potential upward trend.
- To confirm this signal, two conditions must be met: The price was below the EMA in the previous period. The current price is above the trailing stop value.
- Confirming the Buy Signal: Verify that both conditions are met. If so, it’s considered a confirmed buy signal, indicating a possible entry point for a long position.
- Criteria for a Buy Signal:
- Identifying a Sell Signal
- Criteria for a Sell Signal:
- A sell signal occurs when the price of the asset crosses below the EMA, indicating a potential downward trend.
- Two conditions must be fulfilled to confirm a sell signal: The price was above the EMA in the previous period. The current price is below the trailing stop value.
- Confirming the Sell Signal: Ensure that both criteria are satisfied. If they are, it’s considered a confirmed sell signal, suggesting a possible entry point for a short position.
- Criteria for a Sell Signal:
By following these steps, you can use the EMA and ATR indicators to identify potential buy and sell signals. This method combines trend analysis with volatility-based risk management, aiming to enter and exit trades in alignment with market momentum while managing downside risk. Remember, no strategy guarantees success, and it’s crucial to adapt your approach to your individual trading style, goals, and risk tolerance.
Step 4: Manual Execution
- Executing a Buy Position
- Confirm Buy Signal: First, ensure that a buy signal has been confirmed based on the criteria you established in Step 3. This includes the price crossing above the EMA, the previous price being below the EMA, and the current price being above the trailing stop value.
- Access Your Trading Platform: Log in to your eToro account and access the trading platform.
- Select the Asset: Choose the specific asset or market that aligns with the buy signal you’ve identified.
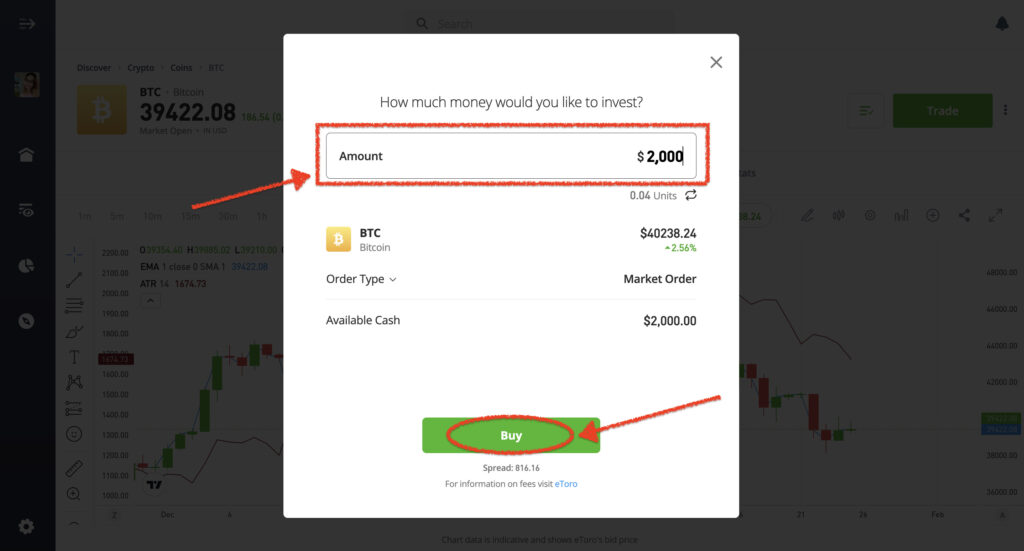
- Open a Buy Position:
- On the trading platform, locate the option to open a new position or trade. This may be represented as “Buy” or “Long.”
- Specify the quantity or size of the position you wish to open. This depends on your risk management and position sizing strategy.
- Confirm the trade by clicking “Buy” or a similar button. Your buy position is now open.
- Specify the quantity or size of the position you wish to open. This depends on your risk management and position sizing strategy.
- Confirm the trade by clicking “Buy” or a similar button. Your buy position is now open.
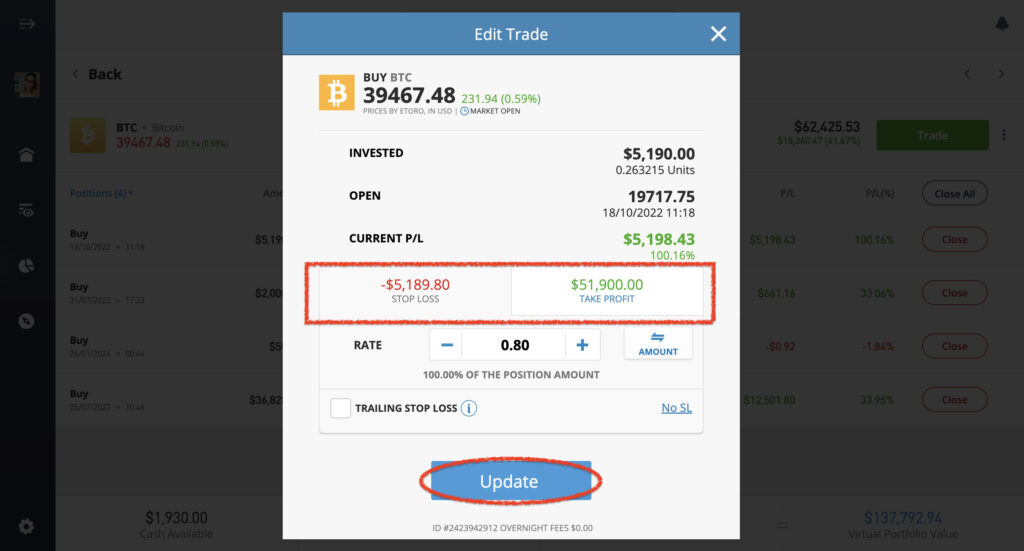
- Set Stop-Loss and Take-Profit: It’s advisable to set stop-loss and take-profit levels to manage your risk. These levels define the maximum loss you’re willing to tolerate and the profit level at which you’ll exit the trade automatically.
- Executing a Sell Position
- Confirm Sell Signal: Ensure that a sell signal has been confirmed based on the criteria established in Step 3. This includes the price crossing below the EMA, the previous price being above the EMA, and the current price being below the trailing stop value.
- Access Your Trading Platform: Log in to your eToro account and access the trading platform.
- Select the Asset: Choose the specific asset or market that aligns with the sell signal you’ve identified.
- Open a Sell Position:
- On the trading platform, locate the option to open a new position or trade. This may be represented as “Sell” or “Short.”
- Specify the quantity or size of the position you wish to open, taking into account your risk management strategy.
- Confirm the trade by clicking “Sell” or a similar button. Your sell position is now open.
- Set Stop-Loss and Take-Profit: Just as with buy positions, it’s important to set stop-loss and take-profit levels for your sell position to manage risk.
Step 5: Monitoring and Adjustments
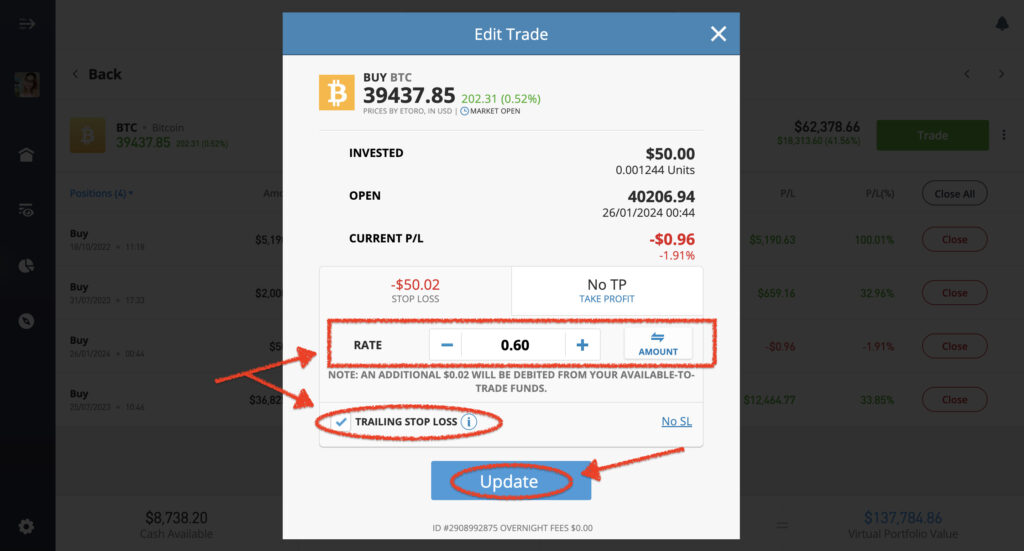
- Regularly Update the Trailing Stop
- Monitor ATR Value: Keep a close eye on the current ATR value as it changes with market volatility. This value reflects the average price movement over a specified period.
- Adjust Trailing Stop: To ensure that your trades are protected and that the trailing stop remains relevant, regularly update the trailing stop distance based on the most recent ATR value. Here’s how to do it:
- Calculate the trailing stop distance by multiplying the current ATR value by the ATR multiplier specified in your trading strategy.
- For example, if your ATR multiplier is 1 and the current ATR value is 0.6, your trailing stop distance would be 0.6 * 1 = 0.6.
- Apply Updated Trailing Stop: Modify your existing trailing stop levels on your open positions to reflect the newly calculated trailing stop distance. This ensures that your stops are dynamically adjusted to market conditions.
- Continuously Monitor EMA and Price Relations
- Watch for New Signals: Keep a vigilant eye on the relationship between the EMA and the price of the asset on your trading chart. Be attentive to any new buy or sell signals that may develop based on the criteria established in Step 3.
- Confirm Signals: Before taking any action, confirm that the criteria for buy or sell signals are met. Ensure that the price has crossed the EMA as described and that the preceding price action aligns with your signal conditions.
- Execute New Positions or Adjust Existing Ones: If new signals are confirmed, you have the option to execute new positions following the steps outlined in Step 4. Additionally, if you have existing positions, consider adjusting stop-loss and take-profit levels based on the new signals to manage your trades effectively.
By regularly updating the trailing stop based on the ATR value and staying vigilant for new signals, you can adapt to changing market conditions and make informed decisions to manage your trades effectively. Successful trading often requires both proactive and reactive actions based on a well-defined strategy.
Remember, manual replication requires continuous market monitoring, and you should be familiar with technical analysis concepts. Always ensure your trading decisions align with your overall trading strategy and risk tolerance.
Shaft Trend Circle (STC)
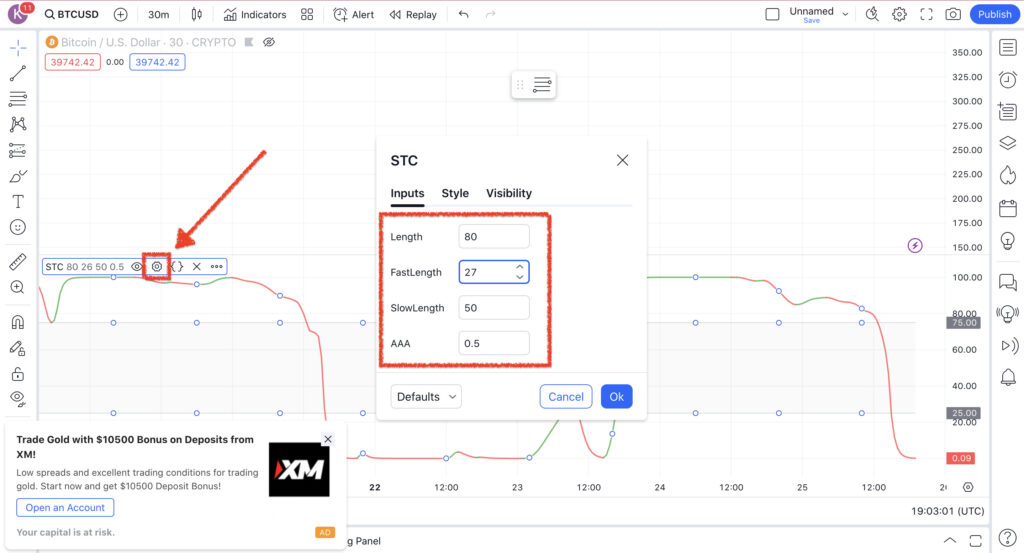
The Shaft Trend Circle (STC) indicator is a versatile and sophisticated tool used in financial trading to identify market trends and potential entry points for trades. Its configuration and interpretation are crucial for traders looking to optimize their strategies. Let’s expand on the information about the STC indicator to understand it better:
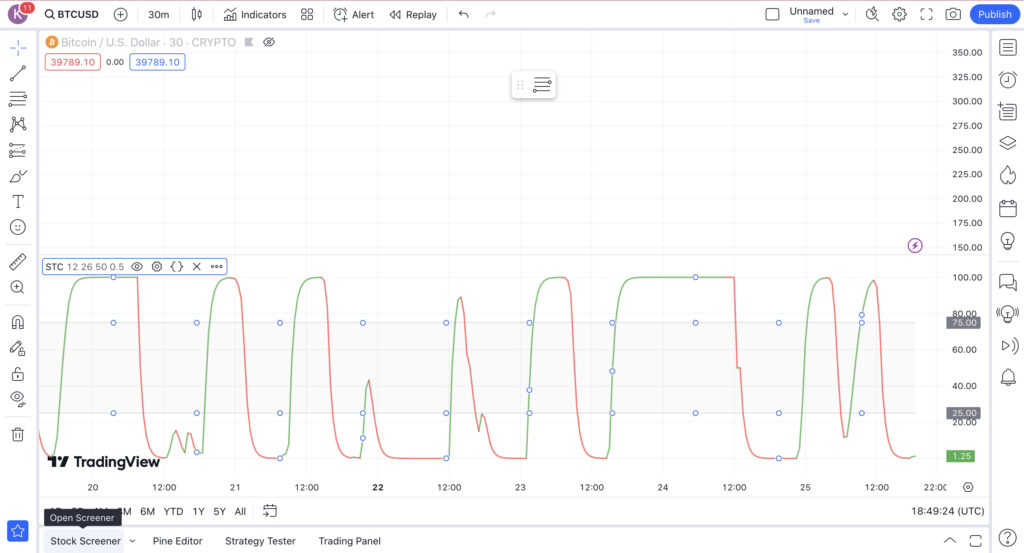
Configuration of the STC Indicator
- Length (80): This setting, often referred to as the ‘main length’ or ‘period’, dictates the overall sensitivity of the indicator. A length of 80 means the STC is analyzing the last 80 periods (like 80 days in a daily chart). A higher number makes the indicator less sensitive to recent price changes, thus smoothing out the signal and focusing on longer-term trends.
- Fast Length (27): This parameter sets the period for the faster component of the STC. At 27, it’s responding to changes over a shorter timeframe, allowing the indicator to react more quickly to recent price movements. This fast length helps in capturing the early stages of a trend.
- Slow Length (50): The slow length is set to 50, indicating a medium-term trend analysis. This length is slower to react compared to the fast length, thereby filtering out more noise and short-term volatility. It’s useful for confirming the trends suggested by the faster component.
- AAA Value (0.5): This might refer to a specific smoothing or weighting factor used in the STC formula. A value of 0.5 could be balancing the weight between the fast and slow components, providing a middle ground in the sensitivity of the indicator.
Interpretation and Use in Trading
- STC Line Color and Position: The color and the position of the STC line are integral in signaling potential trading opportunities. For example, a change in color might indicate a shift in trend direction.
- Identifying Entry Points: When the STC line changes in a certain way (like crossing above or below a key level or changing color), it can signal a good entry point for a trade. For instance, crossing above a certain level might indicate a buy signal, while crossing below could suggest a sell signal.
- Reducing False Alarms: By combining fast and slow market trends, the STC is designed to provide more reliable signals. It aims to reduce the number of false alarms that can occur with more reactive indicators, thus potentially increasing the accuracy of trade signals.
Implementing the Strategy
Implementing the Shaft Trend Circle (STC) strategy in conjunction with UT Bot Alerts requires an integrated approach where you use the strengths of both to inform your trading decisions. The STC indicator offers a nuanced view of market trends, while UT Bot Alerts can provide timely trade signals. Here’s a guide on how to combine these two effectively:
The first step in implementing this strategy is understanding the indicators and their settings. The UT Bot Alerts indicator is used twice in this strategy, each with different settings for buy and sell signals. The Shaft Trend Circle (STC) indicator is also a crucial part of this strategy, providing insights into market trends.
Once you’ve understood the indicators, the next step is identifying the specific conditions for entering trades. For long trades, a buy signal from the UT Bot Alerts and a green STC line below the 25 level are required. For short trades, a sell signal from the UT Bot Alerts and a red STC line above the 75 level are needed. These conditions help identify potential trading opportunities.
Entering a Long Trade
In this strategy, initiating a long trade is based on two key indicators: the UT Bot Alerts and the Shaft Trend Circle (STC).
The first condition to meet is a buy signal from the UT Bot Alerts indicator. This signal is a result of specific market conditions that suggest a potential upward price movement. It’s an alert that the current market trend might be turning bullish, indicating it could be an opportune time to buy.
The second condition involves the STC indicator. For a long trade to be considered, the STC line needs to be green and positioned below the 25 level. The color green in the STC indicator represents a bullish or upward trend. The position below the 25 level suggests that the market is not in an overbought condition. An overbought market could indicate a potential price decrease, which is not ideal for entering a long trade.
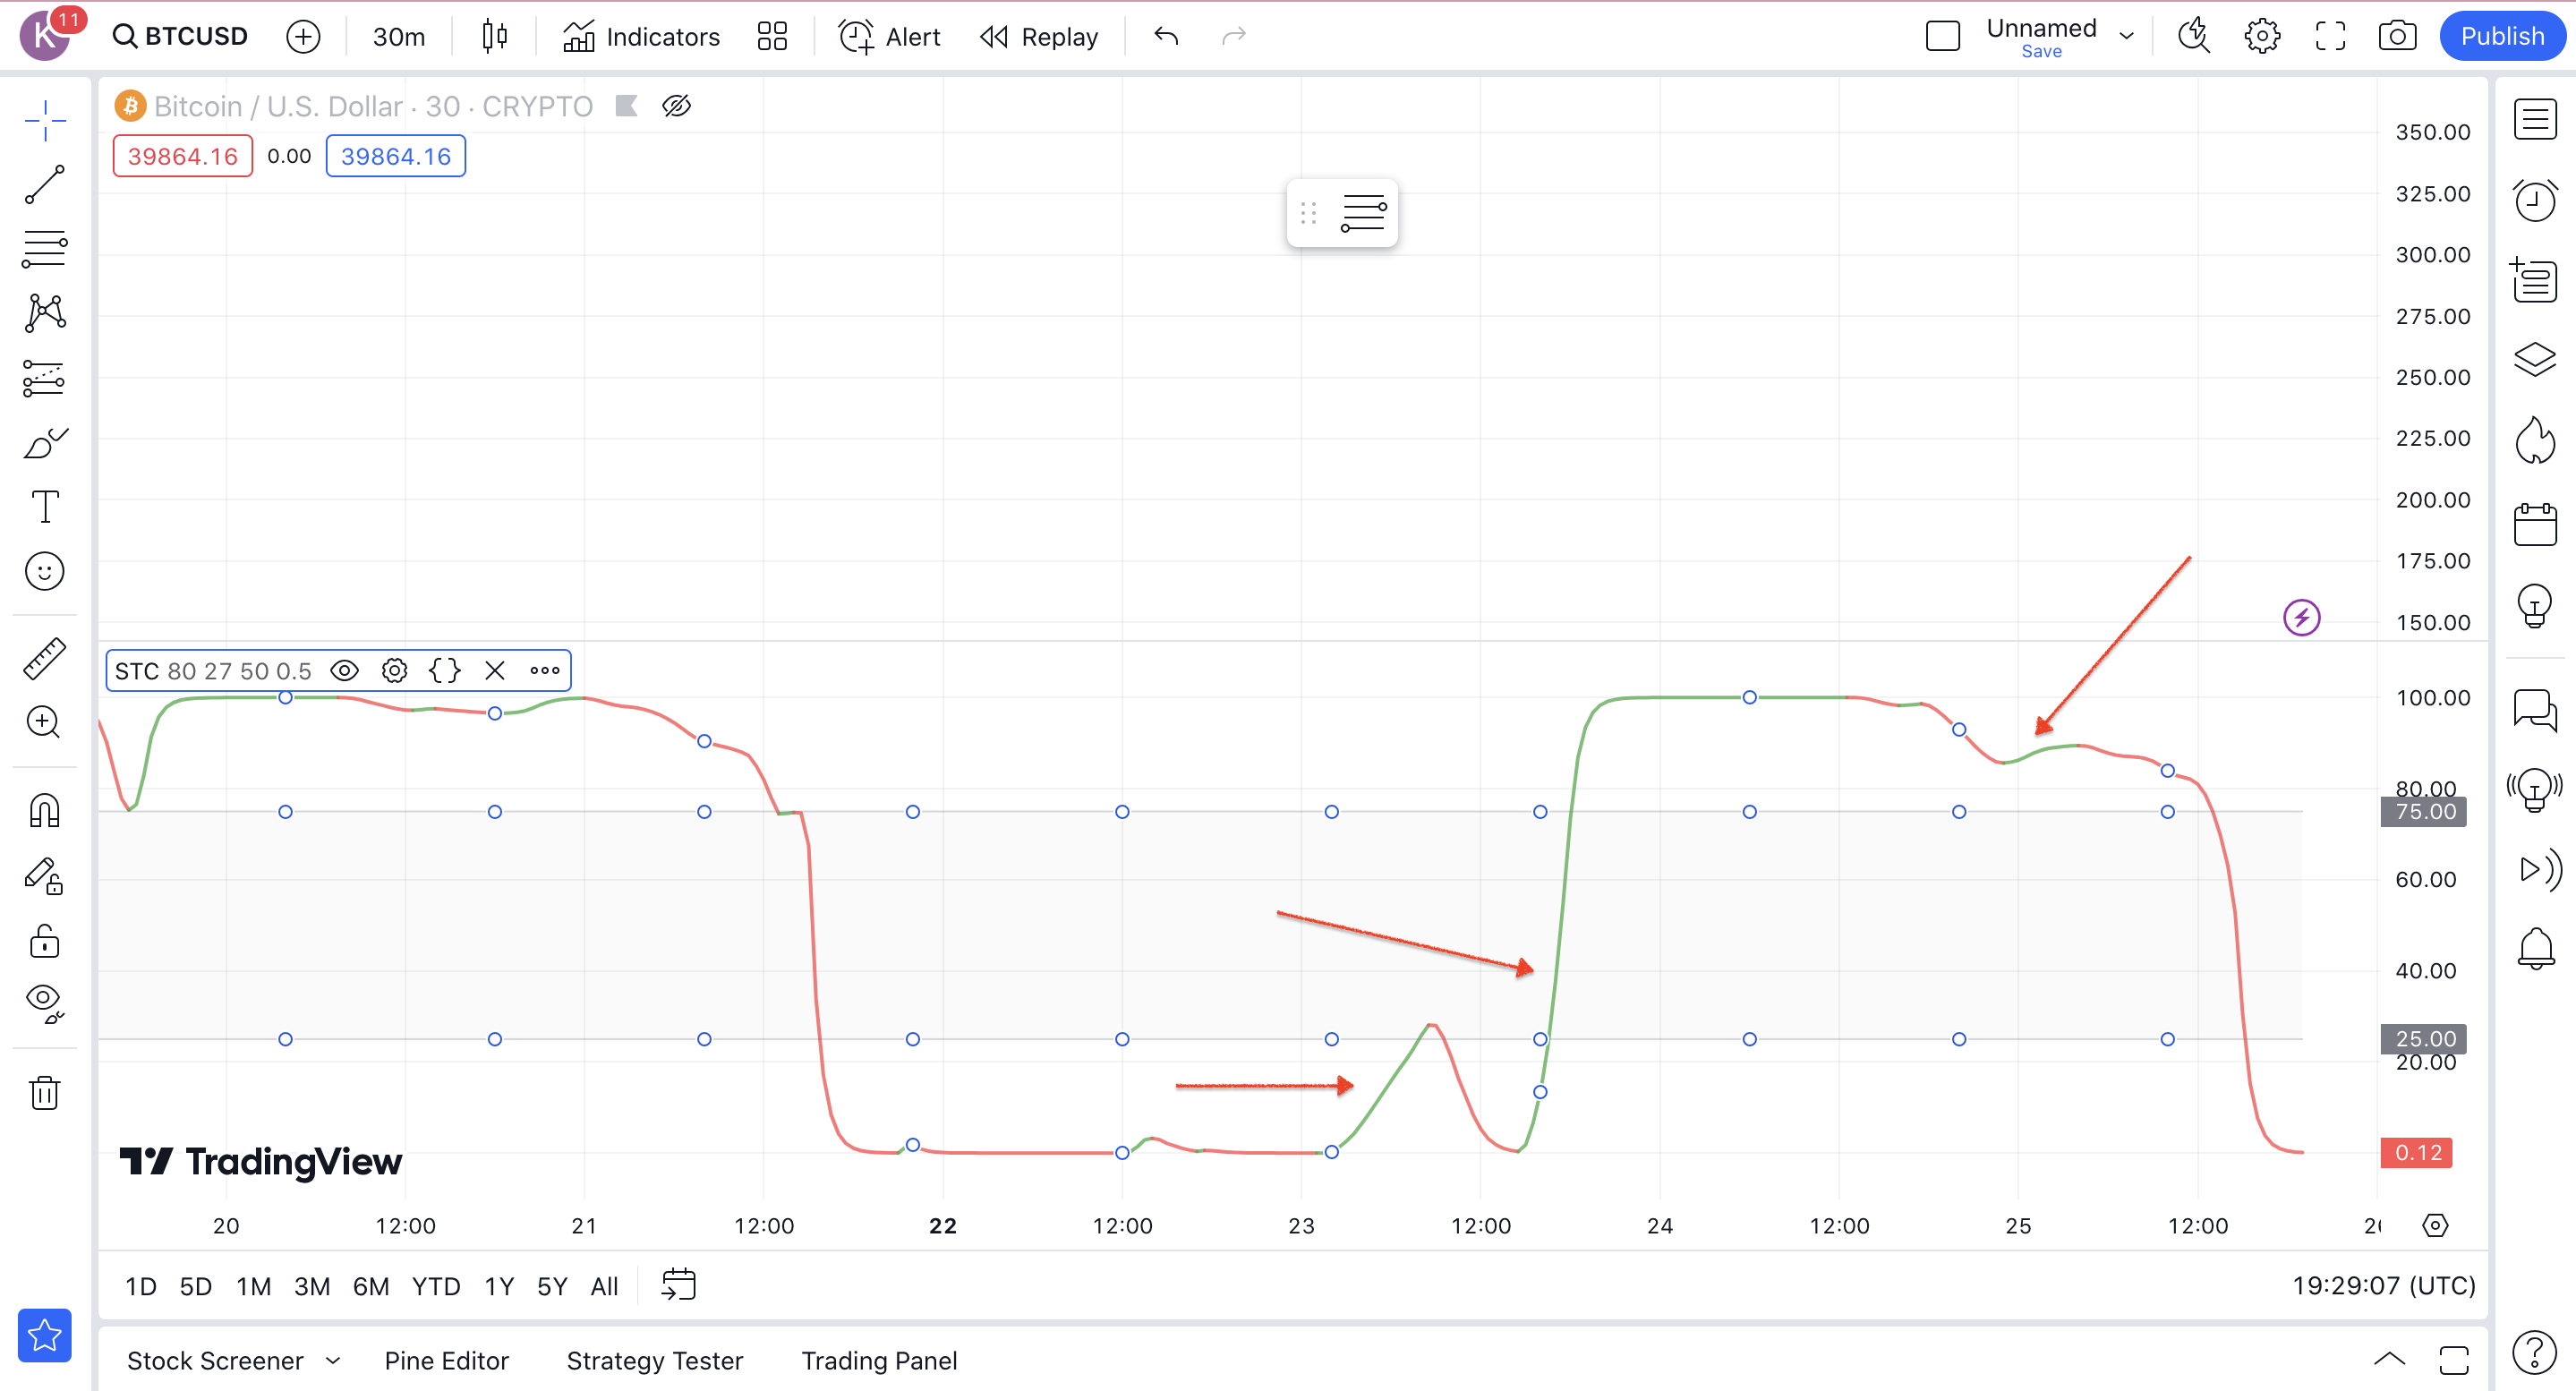
Therefore, when the STC line is green and below the 25 level, it suggests that the market trend is bullish, and there is still room for the price to move up before reaching an overbought condition. This provides a good opportunity to buy or enter a long trade.
Entering a Short Trade
In this strategy, initiating a short trade is based on two key indicators: the UT Bot Alerts and the Shaft Trend Circle (STC). The first condition to meet is a sell signal from the UT Bot Alerts indicator. This signal is a result of specific market conditions that suggest a potential downward price movement. It’s an alert that the current market trend might be turning bearish, indicating it could be an opportune time to sell.
The second condition involves the STC indicator. For a short trade to be considered, the STC line needs to be red and positioned above the 75 level. The color red in the STC indicator represents a bearish or downward trend. The position above the 75 level suggests that the market is not in an oversold condition. An oversold market could indicate a potential price increase, which is not ideal for entering a short trade.
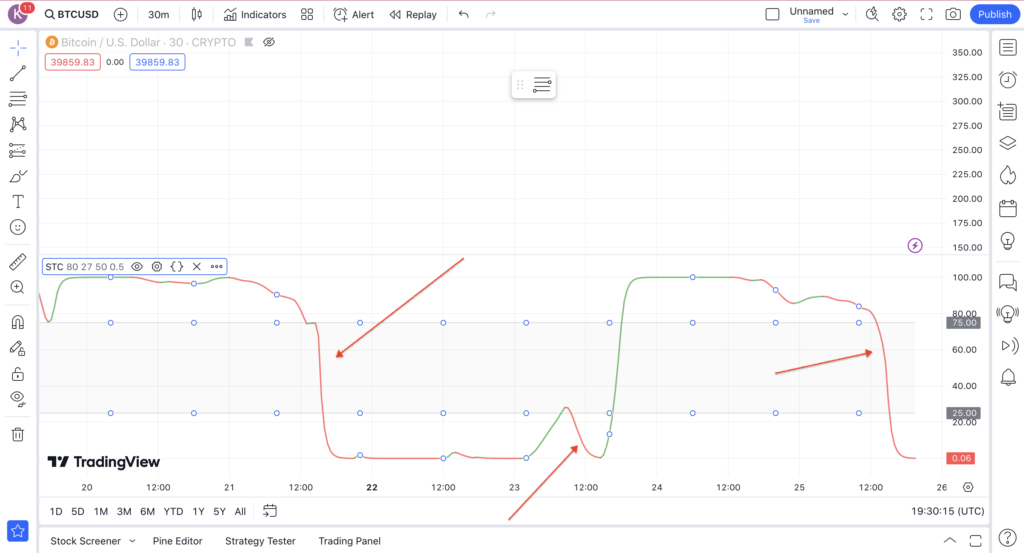
Therefore, when the STC line is red and above the 75 level, it suggests that the market trend is bearish, and there is still room for the price to move down before reaching an oversold condition. This provides a good opportunity to sell or enter a short trade.
Setting Stop Loss and Take Profit

In trading, managing risk is just as important as identifying opportunities. For this strategy, the stop loss is set at the previous swing low for long trades and the previous swing high for short trades. This method of setting stop losses ensures that a trade will be exited before a significant trend reversal, minimizing potential losses. Alternatively, you can use three times the ATR value for your stop loss, providing a dynamic stop loss that adjusts to market volatility. The take profit is set at one times the risk, ensuring a balanced risk-to-reward ratio.
Backtesting the Strategy
Backtesting is a crucial step in validating any trading strategy. It involves applying the strategy to historical data and analyzing the results to gauge its effectiveness. For this particular strategy, backtesting showed a win rate of 57% after 180 trades over two and a half months. This performance led to a growth in account size from $1,000 to $1,230, a return of 23%. These results suggest that the strategy can be profitable over time, but it’s important to remember that past performance is not indicative of future results.
Conclusion
Trading is a journey filled with ups and downs, but with the right strategy, it can become a profitable endeavor. The combination of UT Bot Alerts and Shaft Trend Circle indicators offers a unique approach to trading, providing clear entry and exit points while managing risk effectively. This strategy, like all trading strategies, requires patience, discipline, and a solid understanding of market dynamics. Remember, past performance is not indicative of future results, so always do your own research and consider your risk tolerance before trading. As with all journeys, the road to trading success is often winding, but with the right tools and strategies, it can lead to rewarding destinations.
Ainu Token aims to offer impartial and trustworthy information on cryptocurrency, finance, trading, and shares. However, we don't provide financial advice and recommend users to conduct their own studies and thorough checks.
Comments (No)