In the fast-paced and ever-changing realm of cryptocurrency trading, having effective strategies is crucial for navigating the turbulent waters of the market. Among the recent attention-grabbing approaches is one based on the fascinating indicator called “Trendlines with Breaks,” popularized by Lux Algo. This article will provide a comprehensive exploration of the strategy, starting with its setup and followed by detailed entry and exit rules. To assess its efficacy, the strategy was put to the test through backtesting on Bitcoin’s 5-minute chart, yielding insightful results that shed light on its potential in the dynamic crypto trading landscape.
The “Trendlines with Breaks” strategy revolves around identifying and utilizing key trendlines in the market, which can serve as strong indicators of price movement. By paying close attention to trendline breaks, traders can potentially capitalize on significant price shifts and position themselves advantageously. The strategy’s backtesting on Bitcoin’s 5-minute chart offers valuable insights into its historical performance and provides traders with valuable data to evaluate its potential effectiveness in their own trading endeavors. As the cryptocurrency market continues to evolve, staying informed about innovative strategies like this one can prove invaluable for traders seeking a competitive edge.
Understanding the Indicators
Mastering the “Trendlines with Breaks” strategy begins with a precise setup of the indicators involved. The first and central indicator is “Trendlines with Breaks,” which serves as the foundation of the strategy. This indicator helps identify and draw significant trendlines on the price chart, highlighting potential areas of support and resistance. The key aspect of this indicator is its ability to detect trendline breaks, where the price crosses above or below the trendline, signaling potential shifts in the market sentiment and price direction.
Alongside the “Trendlines with Breaks” indicator, two additional indicators play crucial roles in this strategy. The first is the Exponential Moving Average (EMA), which provides a smoothed representation of the price trend and helps traders discern the overall market direction. By analyzing the relationship between the price and the EMA, traders can gauge the strength of the current trend and potential reversals. The second supporting indicator is Volume, which tracks the number of coins traded over a given period. Volume is vital in confirming price movements and validating the significance of trendline breaks. High volume during a trendline break adds credibility to the signal, indicating strong market participation and increasing the likelihood of a sustained price movement. Properly understanding and setting up these three indicators lay the groundwork for effectively implementing the “Trendlines with Breaks” strategy and can empower traders with valuable insights into the market’s dynamics.
Trendlines with Breaks
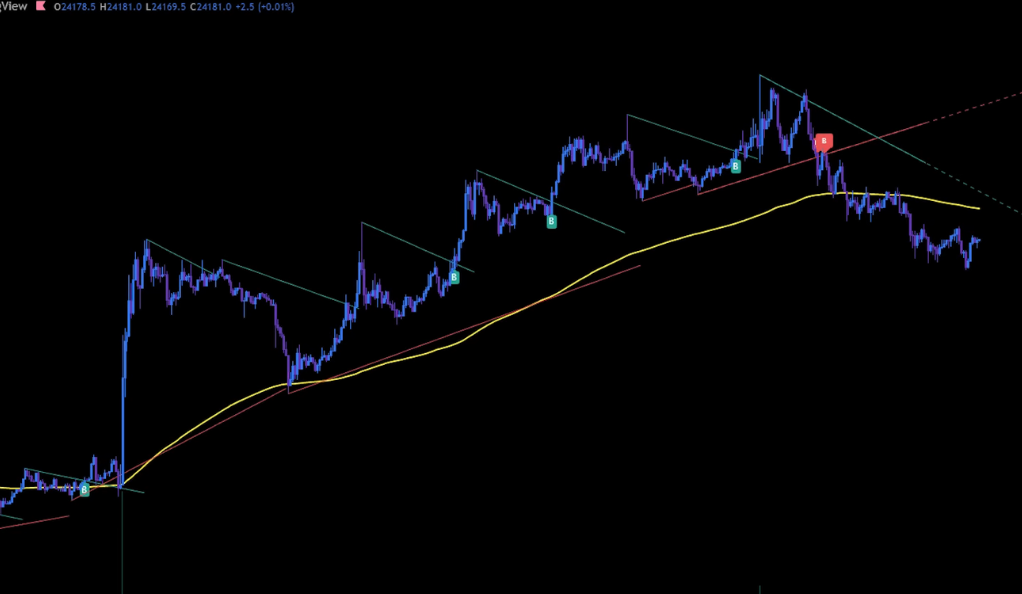
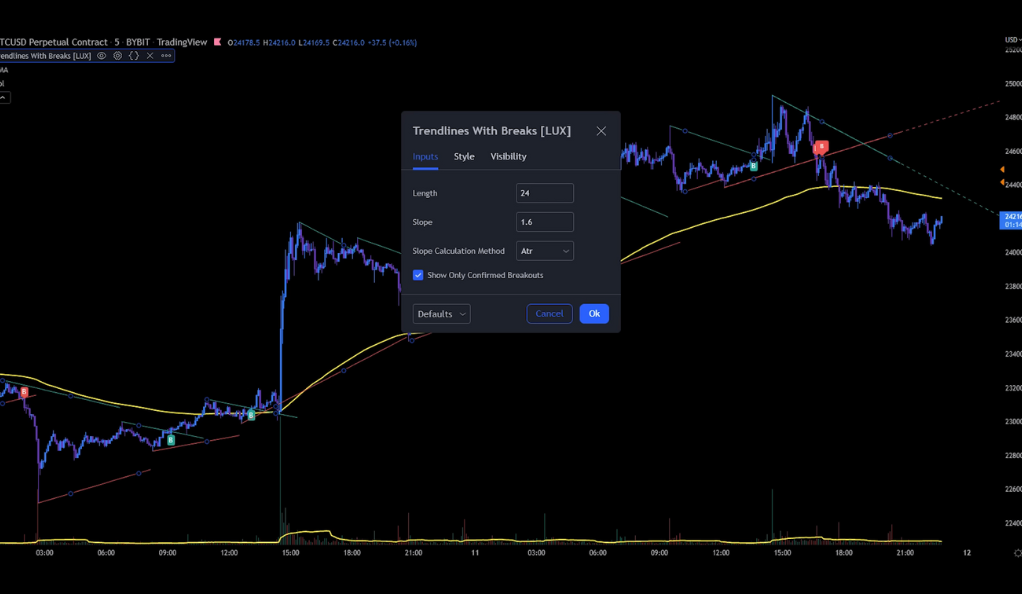
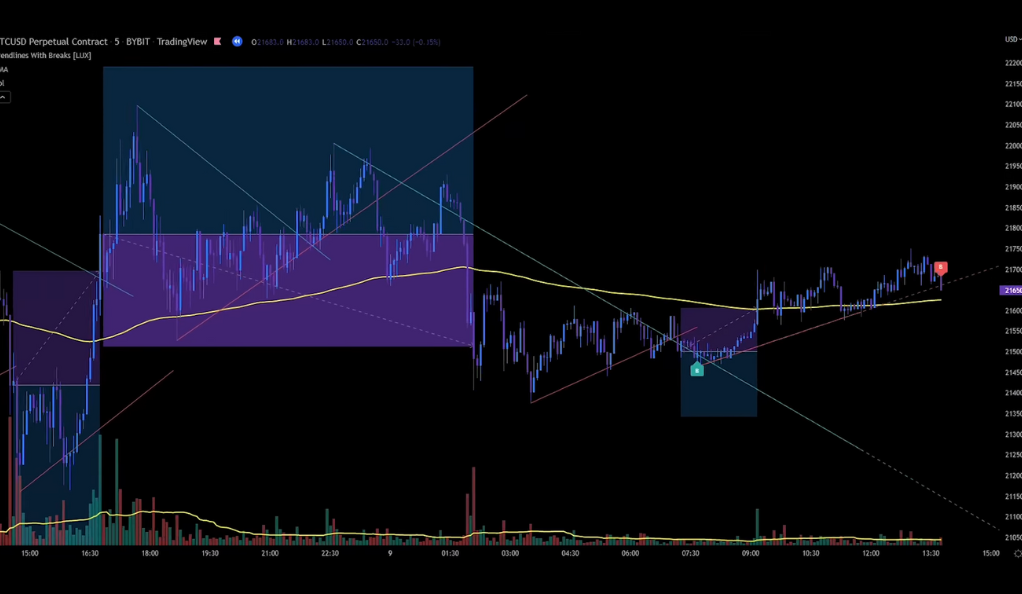
At the heart of the strategy lies the key component – “Trendlines with Breaks.” This indicator plays a central role in identifying crucial trendlines on the price chart and pinpointing potential trading opportunities. To set up the indicator effectively, a length of 24 is chosen, meaning it considers the price data from the past 24 periods to draw the trendlines. Additionally, a slope of 1.6 is applied, determining the steepness of the trendlines, which can help traders assess the intensity of the price movement. Notably, the slope calculation method used here is ATR (Average True Range), a popular volatility measure, which adds another layer of effectiveness to the indicator by incorporating market volatility into its calculations. As a result of this configuration, the “Trendlines with Breaks” indicator becomes a powerful tool in recognizing potential trend shifts and breakout points, enabling traders to seize favorable trading opportunities in the market.
With the “Trendlines with Breaks” indicator properly set up, traders gain valuable insights into the price action’s dynamics. Trendlines drawn using this indicator can reveal areas of support and resistance, critical for making informed trading decisions. When the price crosses above or below these trendlines, indicating a break, it can serve as a signal for potential trend reversals or continuations, depending on the context. This valuable information empowers traders to stay ahead of market movements and capitalize on favorable entry and exit points, enhancing the overall effectiveness of the trading strategy.
EMA (Exponential Moving Average)
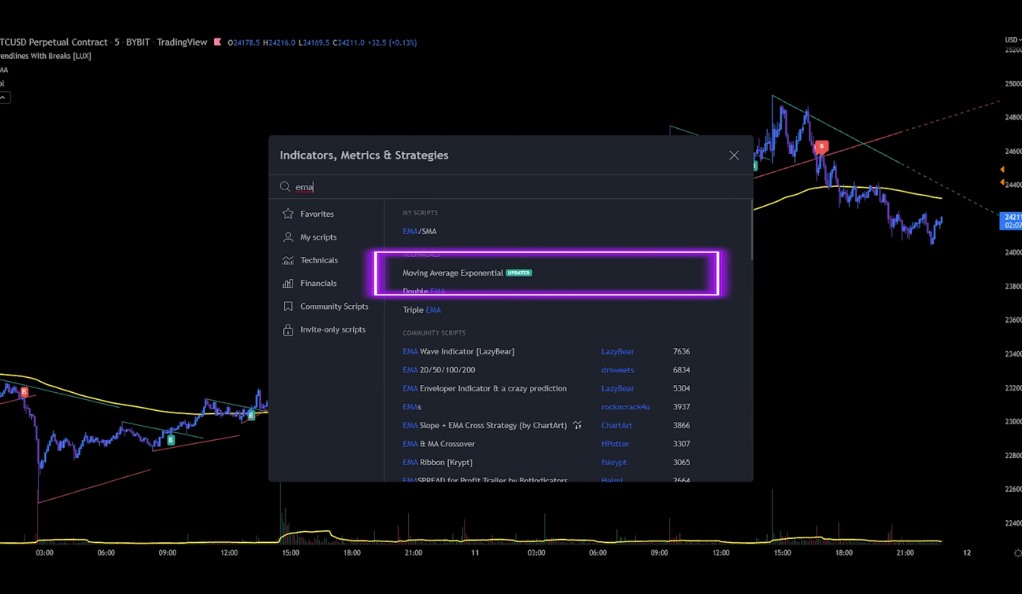
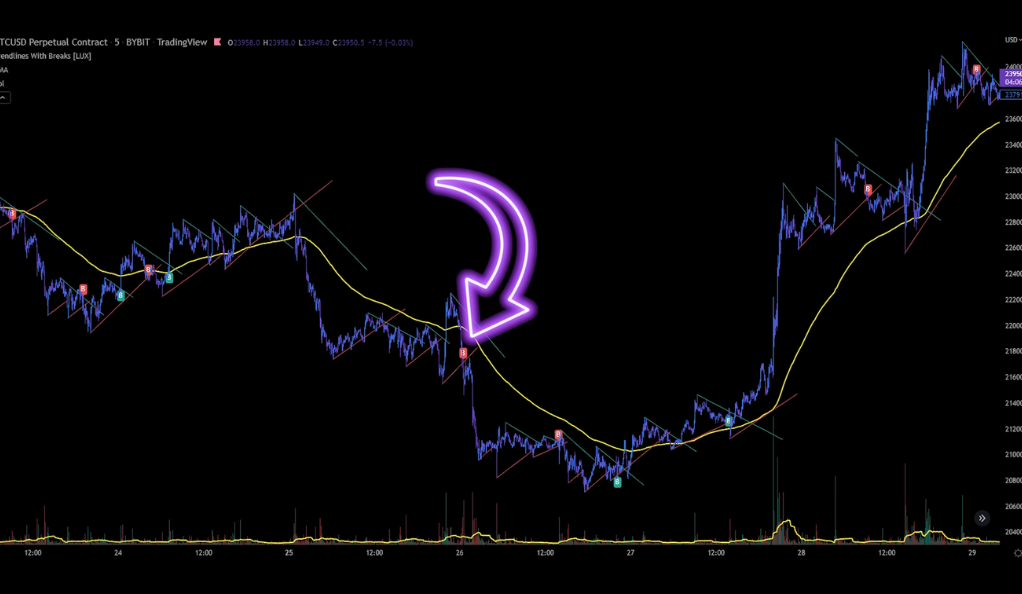
The Exponential Moving Average (EMA) plays a vital role in the strategy, configured with a length of 200. This indicator serves as a valuable tool for determining the overall trend direction in the market. By calculating the average of past prices and giving more weight to recent data points, the EMA provides a smoothed representation of the price trend, filtering out short-term fluctuations. Traders closely observe the position of the price relative to the EMA line, as it becomes a crucial factor in making trading decisions. When the price is above the EMA line, it suggests a potential uptrend, signaling a favorable opportunity for taking a long position. Conversely, when the price falls below the EMA line, it indicates a possible downtrend, guiding traders towards considering a short position. This clear and straightforward analysis using the EMA enhances the precision of the strategy and allows traders to align their trades with the prevailing market trend, increasing the chances of successful outcomes.
Volume
The Volume indicator is a crucial component of the strategy, configured with a Moving Average (MA) length of 30. This indicator offers valuable insights into the level of market activity by tracking the number of coins traded over a specific period. It plays a vital role in confirming the signals generated by the “Trendlines with Breaks” and EMA indicators. When the price breaks a trendline or aligns with the EMA, high volume during these price movements adds credibility to the signals, indicating strong market participation and validating the potential significance of the trading opportunities. Conversely, low volume during price movements might suggest weak market interest, prompting traders to exercise caution in their trading decisions. By incorporating the Volume indicator alongside the other indicators, traders gain a more comprehensive understanding of the market dynamics, making their trading strategy more robust and increasing the likelihood of successful trades.
The Entry Rules: Timing the Market
The strategy’s entry rules involve trading only with the current trend. Traders wait for clear signals from the “Trendlines with Breaks” indicator and the EMA position. Entry occurs when the price breaks a trendline in line with the EMA trend and is confirmed by significant volume, aiming to time the market effectively for favorable trade opportunities.
Long Positions
To enter a long position using the strategy, three conditions must be satisfied: First, the price should be positioned above the 200 EMA line, indicating an uptrend. Second, a green buy signal from the Trendlines indicator should be present, signaling a potential bullish breakout. Finally, the Volume indicator must show a green candle that has closed above the 30 MA line, confirming strong market activity and supporting the validity of the potential long trade. By adhering to these conditions, traders can effectively identify opportune moments to enter long positions, aligning their trades with the prevailing upward trend and increasing the likelihood of successful outcomes.
Short Positions
To execute short positions using the strategy, the conditions mirror those for long positions. Firstly, the price should be below the 200 EMA line, indicating a downtrend. Secondly, a red sell signal from the Trendlines indicator must be present, indicating a potential bearish breakout. Lastly, the Volume indicator should show a red candle that has closed above the 30 MA line, confirming heightened market activity and supporting the validity of the potential short trade. By adhering to these conditions, traders can effectively identify opportune moments to enter short positions, aligning their trades with the prevailing downward trend and increasing the likelihood of successful outcomes.
The Exit Rules: Knowing When to Leave
Effective exit rules are crucial for successful trading, and in this strategy, knowing when to leave is equally important as knowing when to enter. For long positions, the stop loss is set at the recent swing low, providing a level of protection against potential adverse price movements. Conversely, for short positions, the stop loss is placed at the recent swing high. Additionally, the strategy employs a risk-to-reward ratio of 1 to 1.5 for setting targets. This balanced approach to risk management ensures that potential gains outweigh potential losses, providing traders with a structured and disciplined exit strategy. By carefully adhering to these exit rules, traders can better manage their positions, enhance overall profitability, and safeguard their capital in the volatile cryptocurrency market.
Backtesting: The Proof of the Pudding
Backtesting provides concrete evidence of a strategy’s effectiveness, and in this case, it was conducted over a period of 39 days with 100 setups. Starting with an initial balance of 1000 USD and a risk of 2% per trade, the strategy achieved a win rate of 52%, resulting in an impressive profit and loss (PnL) of 72.51%. As a result, the account grew from 1000 USD to 1730 USD, showcasing the potential profitability of the strategy. However, these results also emphasize the critical importance of risk management. Despite its success, maintaining a disciplined approach to risk management remains essential to protect against potential losses and ensure sustainable trading performance. Traders can draw valuable insights from this backtesting, appreciating both the strategy’s potential and the significance of implementing proper risk control measures in the dynamic world of cryptocurrency trading.
A Word of Caution
A word of caution accompanies the promising backtesting results of the strategy, as the author expresses reservations regarding the repainting signals of the Trendline Indicator. This serves as a reminder that no trading strategy is infallible, and traders should exercise caution and always conduct their due diligence. Repainting signals refer to the indicator recalculating historical data, which could create the illusion of accurate predictions in hindsight. Such discrepancies between historical and real-time signals may impact the strategy’s actual performance in live trading conditions. Therefore, it is essential for traders to thoroughly understand the indicators used in the strategy, be aware of their limitations, and continually monitor and adjust their approach based on real-time market dynamics. A critical and informed approach to trading, combined with risk management, is key to navigating the volatile and ever-changing cryptocurrency market effectively.
Conclusion
The “Trendlines with Breaks” strategy offers a structured approach to crypto trading, with clear entry and exit rules. While backtesting shows promising results, it’s crucial to understand the strategy’s limitations and risks. As with any trading strategy, it’s essential to use it as part of a comprehensive trading plan that includes risk management. Happy trading!
Ainu Token aims to offer impartial and trustworthy information on cryptocurrency, finance, trading, and shares. However, we don't provide financial advice and recommend users to conduct their own studies and thorough checks.
Comments (No)