Have you ever wondered what separates successful traders from the rest? It’s not just luck or intuition; it’s the tools they use. In the vast ocean of trading indicators, the Red K Everrex Effort vs. Results Explorer stands out as a beacon of innovation. Why is it so special? Let’s dive in!
A New Era in Trading Tools
Beyond Traditional Indicators

Step away from traditional indicators like MACD, RSI, or stochastic and embrace the revolutionary Red K Everrex, which transcends the norm. This game-changing tool elevates price action analysis to an unprecedented level, incorporating crucial factors such as momentum, volume, and market sentiment. With Red K Everrex, envision a reality where your trade entries become incredibly precise, resulting in enhanced profits and minimized losses. It’s a trader’s dream come true—an invaluable resource, akin to an experienced guide, unveiling the intricacies of the market and revealing unexplored pathways you never thought possible. Embrace the power of Red K Everrex and unlock new dimensions in your trading journey.
Features That Make You Go “Wow!”
Exploring Volume Price Analysis and Wyckoff Law
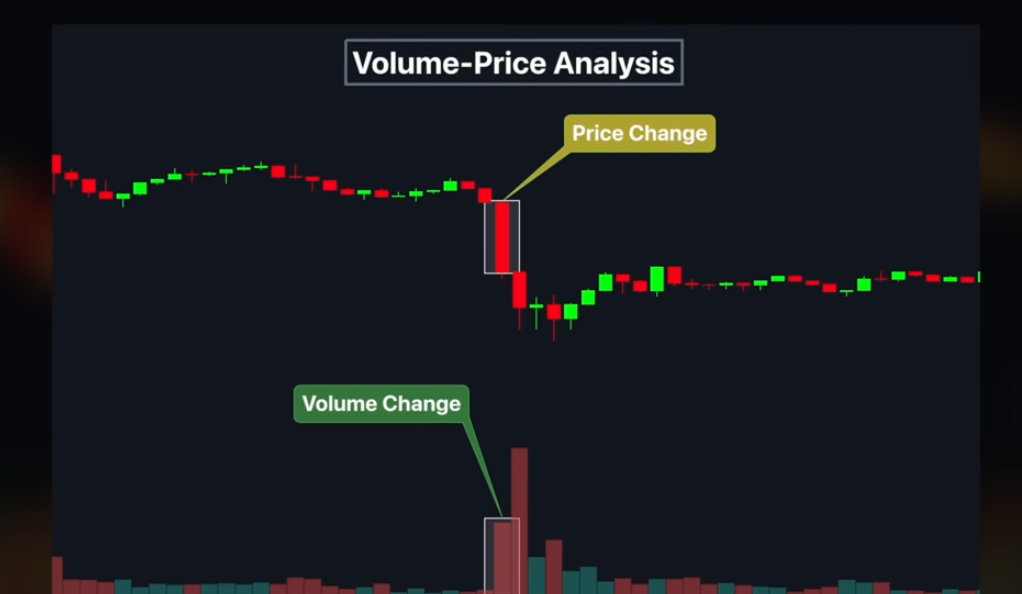
The Red K Everrex stands out due to its unique approach in scrutinizing relative volume and its correlation with price action. This tool functions like a powerful magnifying glass, capable of unveiling the concealed intricacies of the market. Unlike other indicators that merely scratch the surface, Red K Everrex delves deep into the data, revealing multiple layers of critical information crucial for making informed trading choices. It empowers traders not to follow the herd blindly but to grasp the underlying dynamics of market sentiment, thereby aiding in better decision-making and enabling a deeper understanding of crowd behavior—a feature that sets Red K Everrex apart from traditional indicators.
The Magic of Relative Rate of Flow
This intuitive oscillator ranges between 100 and -100, acting as a compass guiding you through the bullish or bearish trends. It’s not just a number; it’s a signal, a whisper from the market telling you where it’s heading. It’s like having a personal interpreter translating the complex language of the market into something you can understand and act upon.
Volume Price Analysis (VPA): The Heart of the Matter
Understanding Core Concepts
Volume Price Analysis (VPA) serves as the lifeblood of the market, offering a unique insight into its underlying dynamics. More than a mere display of numerical data and charts, VPA enables traders to connect with the market’s heartbeat, capturing its essence and comprehending its ever-changing emotions, fears, and aspirations. By being in tune with the market’s rhythm, VPA allows traders to metaphorically dance alongside it, aligning their moves with its beat. This profound understanding of market sentiment empowers traders to make informed decisions, responding sensitively to the market’s fluctuations and crafting strategies that resonate harmoniously with its collective actions. In essence, VPA goes beyond conventional analysis to offer a deep and intuitive understanding of the market’s pulse, fostering a symbiotic relationship between traders and the ever-evolving financial landscape.
Volume – The Pulse of the Market
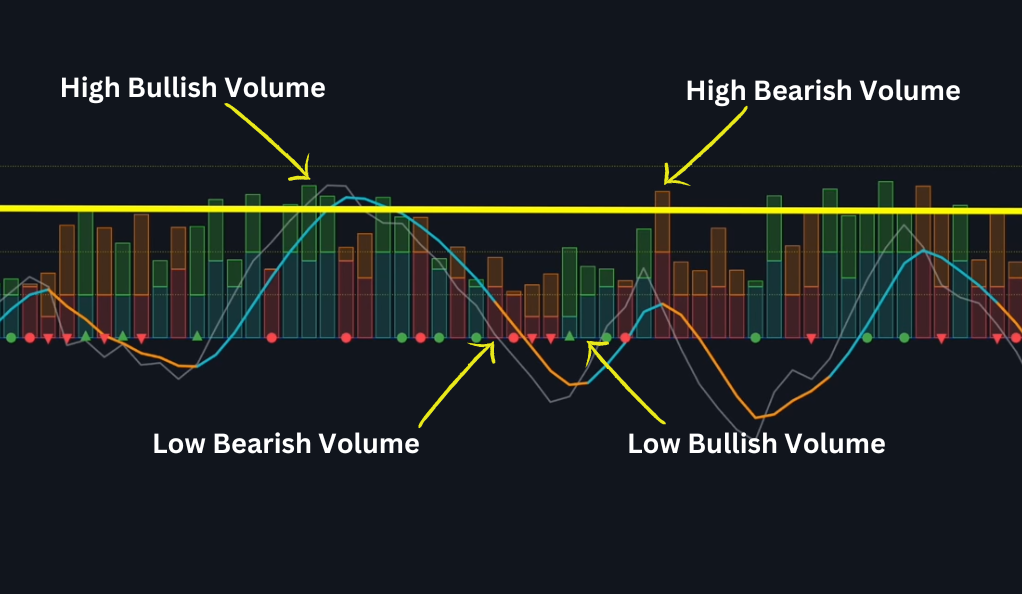
Volume in trading refers to the total number of shares or contracts traded within a specified period, providing crucial insights into market activity and dynamics. Imagine the market as a concert, and volume as the cheering crowd—when the cheers are loud and enthusiastic, it signifies high interest and popularity of the stock or asset. On the other hand, subdued cheers imply lower interest and potential disinterest. Essentially, volume acts as the heartbeat of the market, indicating its vitality and vibrancy. High volume periods suggest active participation, increased liquidity, and potentially significant price movements, while low volume periods may indicate a lack of conviction and subdued market activity. By paying attention to volume patterns, traders can better assess market sentiment, identify potential trend reversals, and make more informed trading decisions.
Price – The Melody of Trading
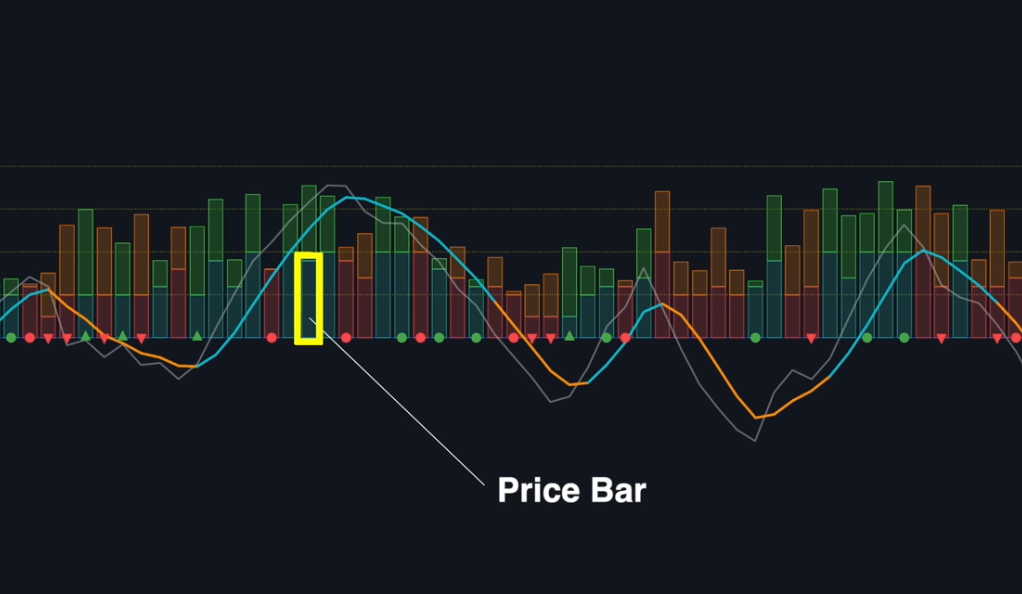
Price in trading represents the prevailing cost per share or contract, embodying the collective perception of an asset’s value within the market. Similar to a widely hummed melody, price resonates with all market participants. When combined with volume, it forms a harmonious symphony that traders can interpret to gain valuable insights. However, the true essence lies beyond merely hearing the melody; it involves a profound understanding and emotional connection with the price movements. Successful traders immerse themselves in the symphony of price and volume, feeling the market’s pulse, and moving in sync with its rhythm. This comprehension allows them to identify trends, support and resistance levels, and potential turning points, thereby empowering them to make well-informed trading decisions based on the intricate interplay of price and volume dynamics.
Scenarios – The Different Tunes of the Market
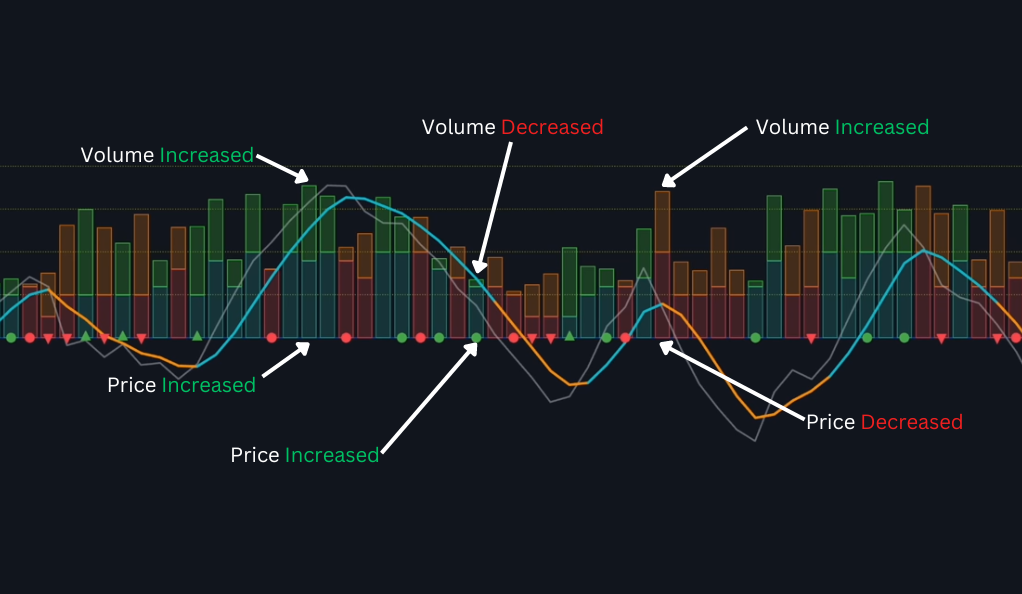
Volume up, price up: The market is dancing to a bullish beat. It’s like a joyful celebration where everyone is moving in unison. Volume up, price down: It’s a bearish groove, and the market is moving down. It’s like a somber melody, a warning of storms ahead. Volume down, price up: Watch out! A potential reversal to the downside might be coming. It’s like a sudden change in tempo, a twist in the plot. Volume down, price down: The market might be gearing up to swing to the upside. It’s like the calm before the storm, a moment of suspense before the big reveal.
Wyckoff Principle – The Philosophy Behind the Beats
Predicting Price Movements
The Wyckoff principle serves as the fundamental music theory of trading, offering traders a comprehensive understanding of market dynamics beyond surface-level observations. Just like music theory goes beyond simply listening to a piece of music, Wyckoff teaches traders to grasp the intricacies of market composition. It emphasizes recognizing patterns, repetitions, and variations in price and volume movements, akin to identifying musical motifs and themes. With this profound knowledge, traders can anticipate future market movements, not merely through familiarity with past occurrences, but by comprehending the underlying structure and construction of the market. Wyckoff empowers traders to read the market like a well-composed symphony, enabling them to make well-informed decisions and navigate the complexities of the financial landscape with greater confidence and precision.
Harmony and Disharmony in the Market
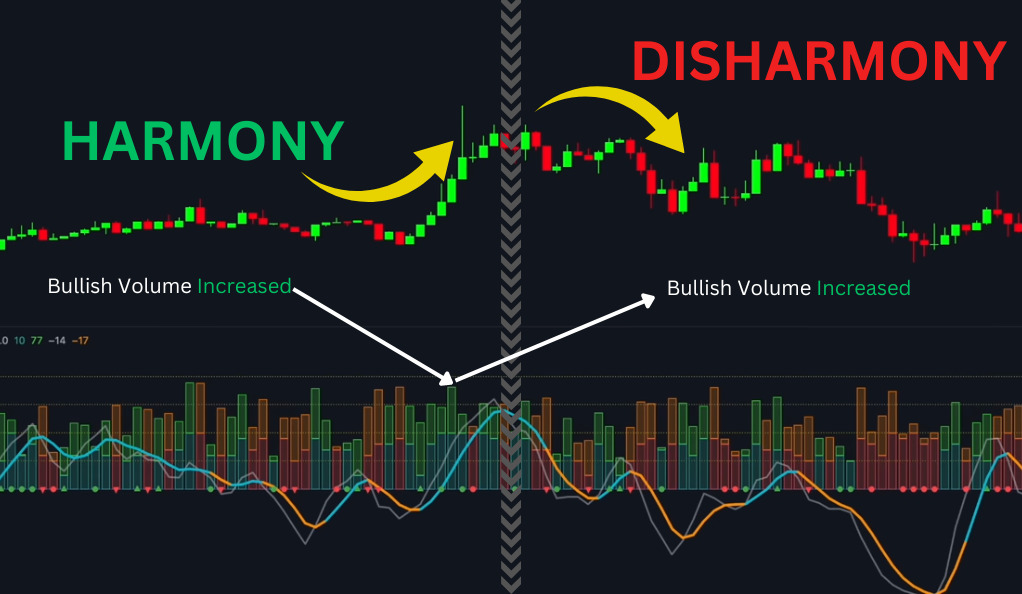
Effort and results in harmony create a scenario where the market behaves as anticipated, much like a skillfully orchestrated symphony with each instrument in perfect sync. This alignment suggests a strong and healthy market condition, reaffirming traders’ confidence in their analysis. However, when effort and results fall out of harmony, it becomes a signal of potential concern. This disharmony may indicate market weakness or an impending trend reversal, much like a discordant note in an otherwise harmonious composition. Traders should take note of these warning signs, as they could be indicative of underlying shifts in market sentiment or fundamental factors that may impact their positions. By recognizing these subtle cues, traders can make more informed decisions and adapt their strategies accordingly to navigate the ever-changing landscape of the financial markets.
Practical Application – Playing the Right Notes
Setting Up the Indicator
Setting up the Red K Everrex is like tuning your instrument. You need to get it just right to make beautiful music. It’s not just about turning knobs and pushing buttons; it’s about understanding what each setting does, how it affects the sound, and how it fits into the overall composition.
Buy and Sell Setups
Buy Setup: It’s like hitting the perfect chord for a bullish trend. It’s not just about timing; it’s about understanding why it’s the right time. Sell Setup: The notes align for a bearish move. It’s like a well-timed drum beat that signals a change in direction.
Additional Tools – The Orchestra
Using additional tools is like adding more instruments to the orchestra. They enhance the sound and make your trading strategy more robust. It’s not just about volume; it’s about texture, color, and depth. It’s about creating a rich, immersive experience that resonates with the listener.
Examples and Strategy – The Concert
Crafting Your Masterpiece
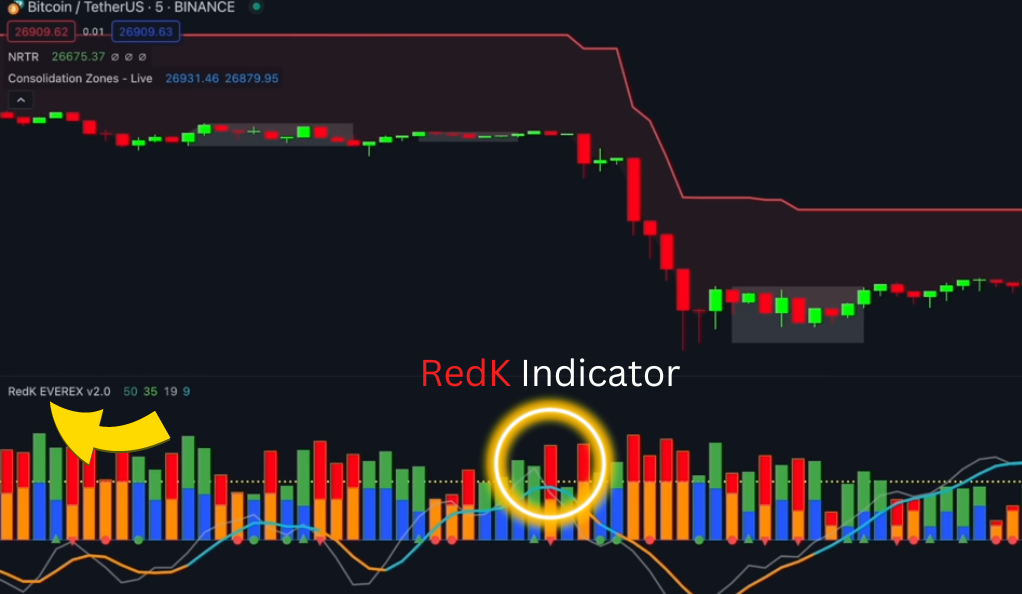
The article provides examples of how to buy and sell using the strategy. It’s like watching a live concert, where you can see how the music is made. It’s not just about following the score; it’s about understanding why each note is played, what it means, and how it fits into the overall piece.
The Versatility of Red K Everrex
This tool is not just a one-hit-wonder. It’s versatile and can adapt to different market conditions. It’s like a musician who can play different genres with ease. It’s not about playing the same tune over and over; it’s about creating new melodies that resonate with the audience.
Conclusion – Encore!
The Red K Everrex Effort vs. Results Explorer is not just another trading tool; it’s a revolution. It’s like having a personal orchestra playing just for you, guiding you through the ups and downs of the market. Whether you’re a seasoned trader or just starting, this tool can be your key to success. So why wait? Give it a try, and let the music of the market lead you to prosperity. It’s not just about making money; it’s about understanding the market, connecting with it, and becoming a part of its ever-changing dance.
Ainu Token aims to offer impartial and trustworthy information on cryptocurrency, finance, trading, and shares. However, we don't provide financial advice and recommend users to conduct their own studies and thorough checks.

Comments (No)