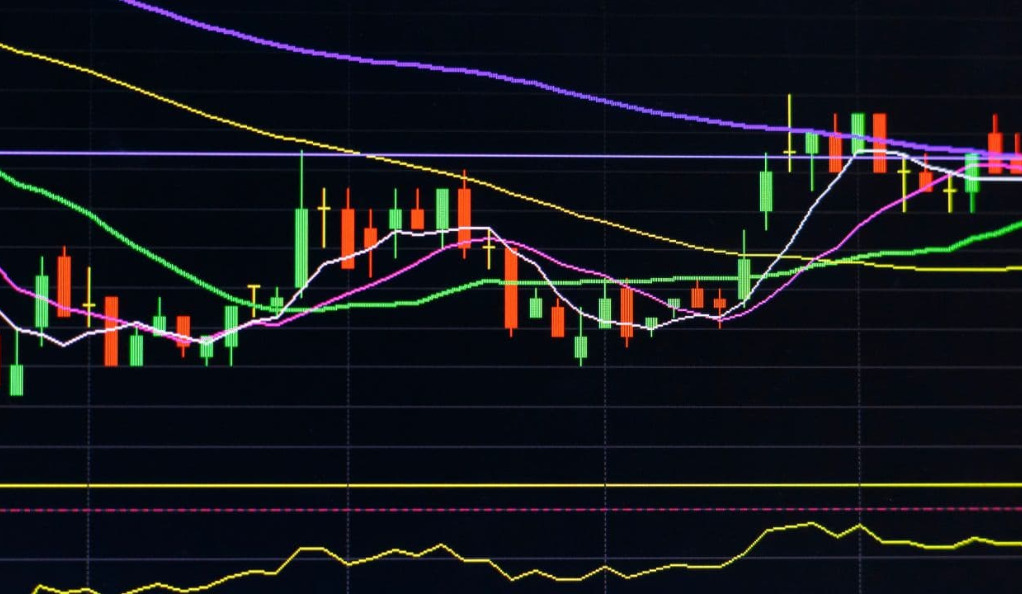
In the fast-paced realm of trading, strategies and indicators serve as navigational aids for traders as they navigate the unpredictable waters of the stock market. Among the various tools available, the Volume Weighted Average Price (VWAP), particularly the Anchored VWAP, has emerged as a powerful tool favored by successful traders. This article aims to provide an in-depth exploration of this trading strategy, focusing on its application to the Apple chart within a 30-minute timeframe.
The Volume Weighted Average Price (VWAP) is a technical indicator that calculates the average price of a security based on price and trading volume. It is popular among traders for identifying the average price at which institutional investors and large market participants trade. The Anchored VWAP takes this further by anchoring the VWAP to a specific point in time, providing insights into market sentiment and potential price movements. Applied to the Apple chart on a 30-minute timeframe, the Anchored VWAP helps identify support and resistance levels and offers a dynamic reference point for understanding market trends and potential price reversals. Traders should combine the Anchored VWAP with other indicators and risk management techniques for successful trading in the dynamic stock market.
Understanding VWAP and Anchored VWAP
VWAP, or Volume Weighted Average Price, is a widely used trading benchmark that calculates the average price at which a stock has traded throughout a given trading day, taking into account both the trading volume and the corresponding prices. Traders often rely on VWAP to gain a deeper understanding of the trend and value of a security. By considering both volume and price, VWAP provides a weighted average that reflects the importance of different trading periods throughout the day. This makes it a valuable tool for assessing whether a particular trade was executed at a favorable or unfavorable price compared to the overall market activity.

Anchored VWAP, on the other hand, introduces a unique feature to the VWAP calculation. While the standard VWAP considers the entire trading day, the Anchored VWAP allows traders to select a specific start and end date for the calculation. This flexibility enables traders to analyze market trends and patterns within a defined timeframe, regardless of whether it is a single trading day or a longer period. By anchoring the VWAP calculation to a specific date range, traders can gain insights into how the stock has performed relative to the average price during that selected period. This can help identify potential support or resistance levels and provide context for future trading decisions. Overall, the Anchored VWAP is a powerful tool that enhances the usefulness of VWAP by allowing traders to focus on specific timeframes and uncover valuable market dynamics.
Identifying a News Event
To implement a successful trading strategy, it is crucial to identify relevant news events that can impact the market. These events can range from earnings reports to stock splits, mergers and acquisitions, economic indicators, or major announcements by companies or governments. By staying informed about these events, traders can anticipate potential market movements and make more informed trading decisions.
Trading platforms often provide features that allow users to display news events on charts. By enabling options like “Dividends on Chart,” “Splits on Chart,” and “Earnings on Chart,” traders can easily spot these events and incorporate them into their analysis. This helps them understand how the market has reacted to similar events in the past, identify price movements or patterns, and adjust their trading strategies accordingly. Staying well-informed about news events can enable traders to adapt quickly, manage risk effectively, and potentially profit from market-changing developments.
Setting the Anchor
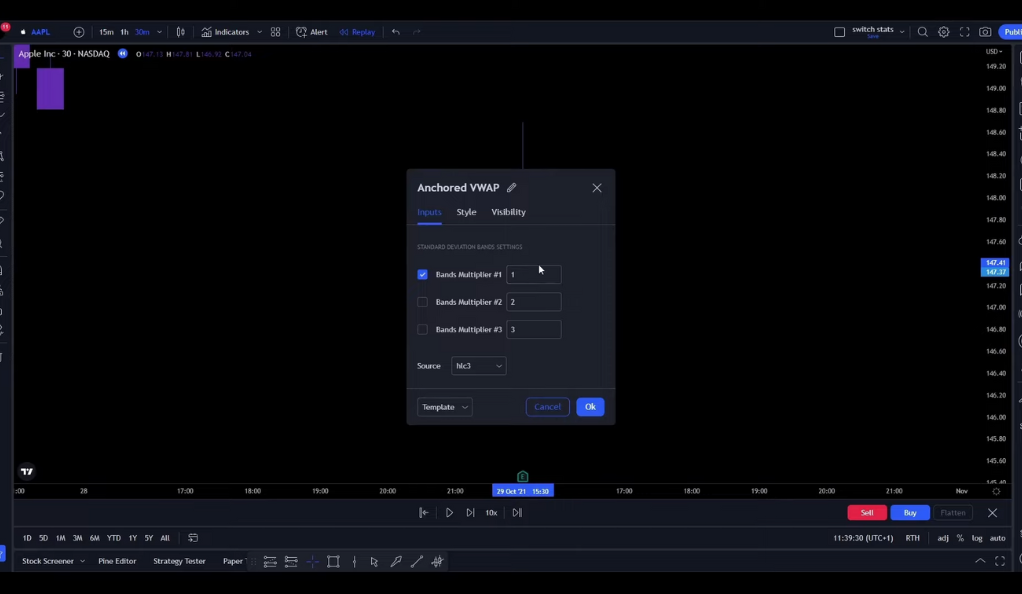
After identifying a news event, the next step in utilizing the Anchored VWAP is to determine the starting point, or anchor, for the calculation. This anchor point is placed at the closing price of the candlestick where the news event occurred. By anchoring the VWAP calculation to this specific point in time, traders can analyze the price action and volume dynamics that followed the news event in a more focused manner.
Placing the anchor at the close of the candlestick associated with the news event allows traders to capture the immediate market reaction to the news. This can provide valuable insights into how the market participants perceived and responded to the information. By isolating this period, traders can observe any significant price movements, shifts in trading volume, or changes in market sentiment that occurred right after the news announcement.
The anchor point serves as the reference for the VWAP calculation, which will then consider the subsequent trading periods. Traders can compare the Anchored VWAP with the standard VWAP or other technical indicators to gain a deeper understanding of how the market reacted to the news event over time. This analysis can help identify potential support or resistance levels, assess the strength of the trend, or spot trading opportunities based on the interaction between price and volume.
The Waiting Game
Once the anchor for the Anchored VWAP is set, the trading strategy recommends exercising patience and waiting for a specific period of time. Traders are advised to let 10 candlesticks pass before making any trading decisions. This waiting period is essential because it allows the VWAP to stabilize and generate more reliable signals.
Waiting for 10 candlesticks to pass provides a sufficient amount of data for the Anchored VWAP calculation to take into account. It allows the indicator to incorporate a significant number of price and volume data points, smoothing out short-term fluctuations and noise in the market. By giving the VWAP time to stabilize, traders can obtain a more accurate representation of the average price and volume levels over the chosen time frame.
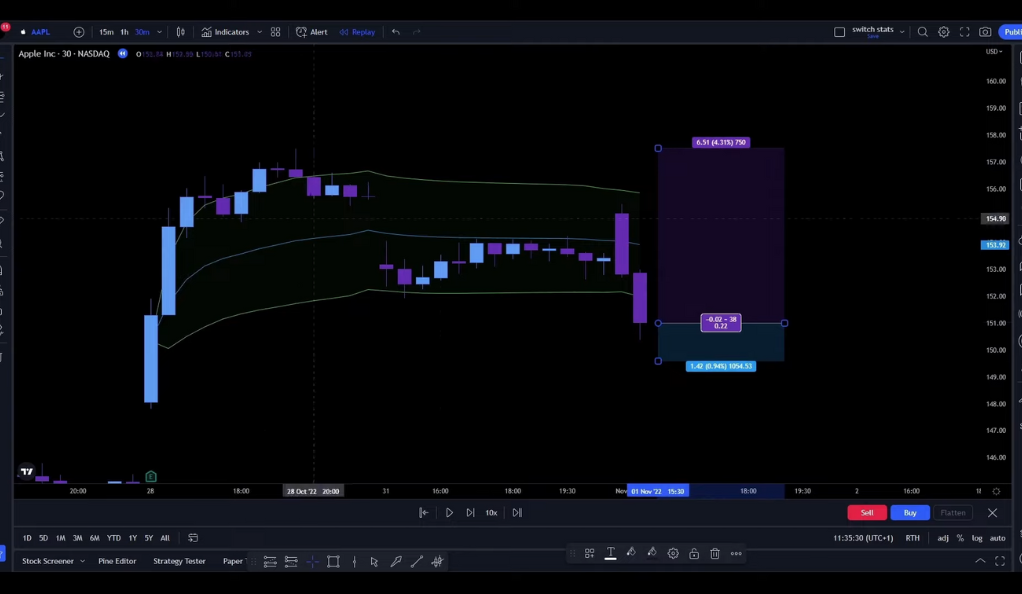
Entering a Long Position
Once the waiting period of 10 candlesticks has passed after setting the anchor for the Anchored VWAP, traders can consider entering a long position based on specific criteria. The decision to enter a long position is triggered when the first candle closes above the upper line of the Bands Multiplier Line.
The Bands Multiplier Line is a technical indicator that provides an upper and lower boundary around the VWAP. It is calculated by multiplying a specified multiplier (such as 2 or 3) with the standard deviation of the VWAP. The upper line represents the upper boundary, indicating potential overbought conditions or bullish momentum.
When the first candle after the waiting period closes above the upper line of the Bands Multiplier Line, it signifies a bullish turn in the trend. This candle’s close above the upper line suggests that the buying pressure has exceeded the upper boundary, indicating potential strength in the upward price movement.
Managing Risk: Stop Loss and Take Profit
Risk management is key in trading. For this strategy, the stop loss is placed at the recent swing low. The take profit target is a risk to reward ratio from 1 to 2. This ensures that potential losses are minimized and profits are maximized.
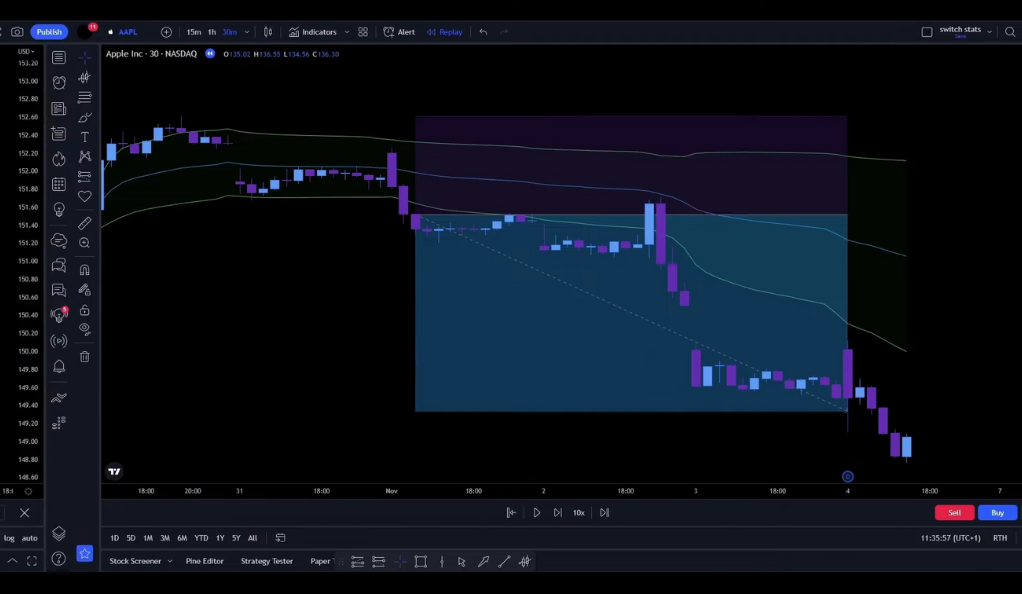
Short Trades: The Flip Side
The strategy for short trades mirrors that of long trades. If the first candle that closes outside of the Bands Multiplier Line closes below this lower line after the 10 candles have passed, it’s time to enter a short position. The stop loss is placed at the recent swing high and the same risk to reward ratio is targeted.
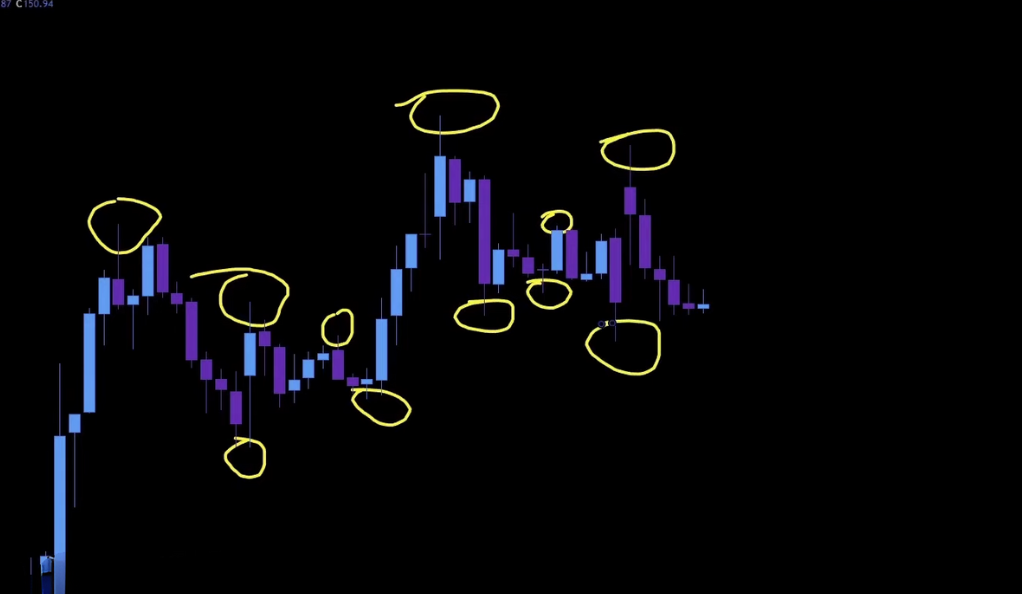
Understanding Swing Highs and Lows
In the context of this strategy, understanding swing highs and lows is crucial. A swing high refers to the highest point of a candlestick, characterized by having two candles to the left with lower highs and two candles to the right with lower highs as well. Conversely, a swing low represents the lowest point of a candlestick, marked by having two candles to the left with higher lows and two candles to the right with higher lows.
Identifying swing highs and lows helps traders recognize potential areas of trend reversal or continuation. A swing high indicates that the price reached a peak and may be poised to reverse its upward movement, potentially signaling a shift from bullish to bearish sentiment. Conversely, a swing low suggests that the price reached a bottom and could potentially rebound, signaling a change from bearish to bullish sentiment.
Backtesting: The Proof in the Pudding
Backtesting is a way to test your trading strategy against historical data to see if it has merit. Using Trader Edge, the backtesting for this strategy started with an initial balance of 1000 USD and using a leverage of 2x. The results? A profit of 34%, with a win rate of 40%. The largest profit trade was 17.1% and the largest loss trade was 6.7%.
Conclusion
The Anchored VWAP trading strategy is a powerful tool for traders looking to capitalize on market trends and patterns. By understanding and applying this strategy, traders can navigate the stock market with more confidence and precision. Remember, in trading, knowledge is power. So, keep learning, keep testing, and keep trading!
Ainu Token aims to offer impartial and trustworthy information on cryptocurrency, finance, trading, and shares. However, we don't provide financial advice and recommend users to conduct their own studies and thorough checks.
Comments (No)