In the dynamic realm of trading, having effective strategies is essential for achieving success. These strategies serve as the backbone of a trader’s journey, offering a roadmap to navigate the often chaotic landscape of financial markets. However, with a vast array of indicators and strategies available, it can be overwhelming to determine which ones will truly lead to success. To alleviate this dilemma, we have compiled a list of the top 5 high win rate trading strategies that have consistently demonstrated their value in the trading arena.
Effective trading strategies have undergone rigorous testing and boast a proven track record of delivering favorable outcomes. These strategies encompass various approaches tailored to different market conditions and trader preferences, such as trend following, breakout, mean reversion, momentum, and range trading. While each strategy has distinct characteristics and indicators, their shared goal is to identify profitable trading opportunities while minimizing risks.
It’s important to recognize that no strategy can guarantee success due to the ever-changing nature of the market. Traders must cultivate discipline, adaptability, and continuous learning to stay ahead. Alongside risk management and thorough analysis, a comprehensive understanding of market factors is crucial for successful implementation. Traders should assess their trading style, risk tolerance, and market conditions to select and refine strategies that align with their goals, thereby improving their chances of consistent profitability in the captivating world of trading.
The Alligator Indicator: A New Twist on an Old Classic
The Alligator Indicator has long been a popular tool among traders for identifying trends and potential trading opportunities. Traditionally, traders wait for all three lines (green, red, and blue) to cross over before taking action. However, we propose a new approach that focuses on the interaction between the green and purple lines, offering an earlier entry signal and the ability to ride the trend from its inception.
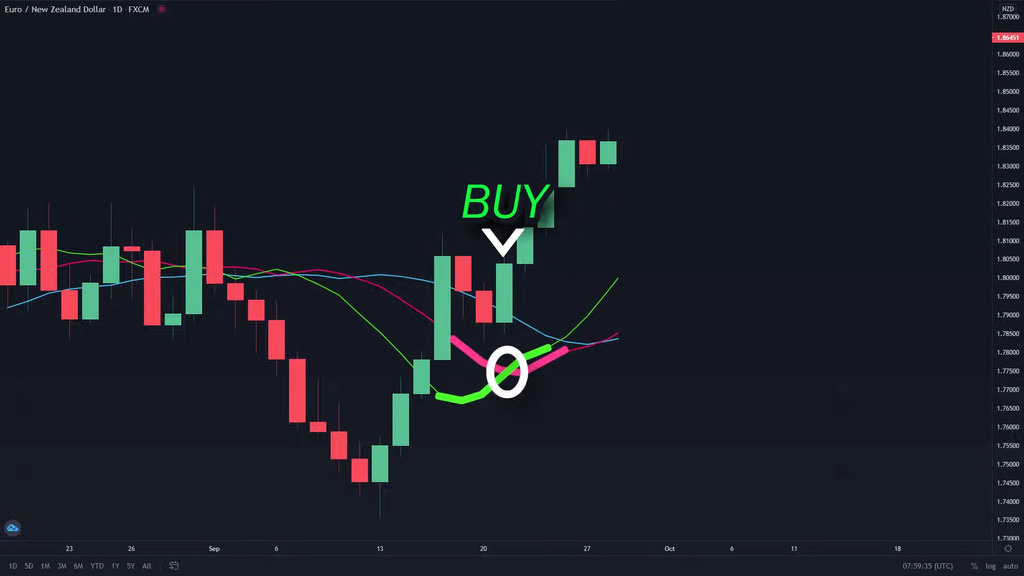
Instead of waiting for all three lines to converge, our strategy suggests waiting for the green line to cross over the purple line. This crossover serves as a trigger for entering a buy position, indicating a potential bullish trend. By entering the market earlier, traders can take advantage of the initial momentum and potentially maximize their profits.
To determine the exit point, the strategy is straightforward. Traders should close their trade once a candle closes below the purple line. This provides a clear and objective signal to exit the position, safeguarding profits and managing risk. By combining the green-to-purple line crossover for entry and the candle close below the purple line for exit, this strategy offers a simplified and systematic approach that has gained popularity among traders.
It’s worth noting that while this new twist on using the Alligator Indicator can be a valuable addition to a trader’s toolkit, it is crucial to consider other factors such as market conditions, risk management, and additional technical analysis tools for comprehensive decision-making. Traders should thoroughly backtest and evaluate the strategy’s performance, adapting it to their trading style and preferences before implementing it in live trading scenarios.
The 200 EMA: The Long-Term Trend Indicator
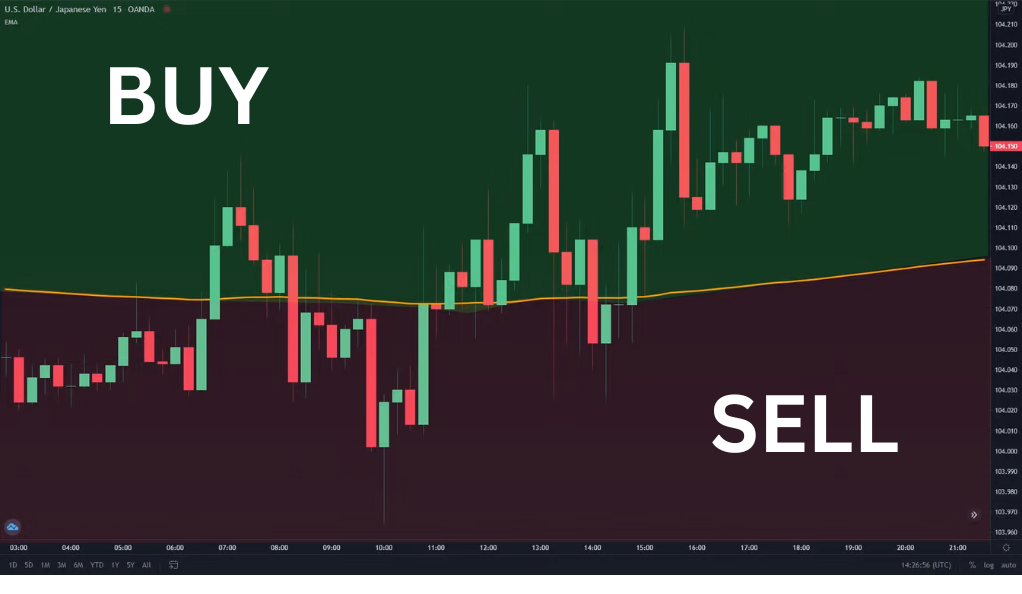
The 200 EMA (Exponential Moving Average) is a widely used and powerful indicator that helps traders identify the long-term trend in the market. This simple yet effective tool provides crucial data for decision-making. The general rule of thumb when using the 200 EMA is to trade in alignment with the long-term trend. If the price is positioned above the 200 EMA, traders should consider taking buy positions. Conversely, if the price is below the 200 EMA, sell positions may be more favorable. By following this guideline, traders can align themselves with the prevailing market direction, potentially increasing the probability of successful trades.
However, the benefits of the 200 EMA don’t end there. When combined with other indicators, this moving average can significantly enhance a trader’s win rate. Just like adding a secret ingredient to a favorite recipe, the incorporation of additional indicators can complement the 200 EMA and further improve trading decisions. By combining multiple indicators, such as oscillators, volume analysis, or support and resistance levels, traders can gain a more comprehensive understanding of market conditions and fine-tune their entry and exit points. This synergy can increase the effectiveness of the trading strategy and potentially lead to more profitable outcomes.
While the 200 EMA is a valuable tool, it’s essential to consider other aspects of trading, such as risk management, fundamental analysis, and market volatility. Traders should thoroughly backtest their strategies, experiment with different indicators, and adapt their approach to suit their individual trading style and risk tolerance. By incorporating the 200 EMA along with other indicators, traders can add depth and precision to their analysis, potentially improving their trading performance and achieving greater success in the markets.
The RSI: A Multi-Functional Tool
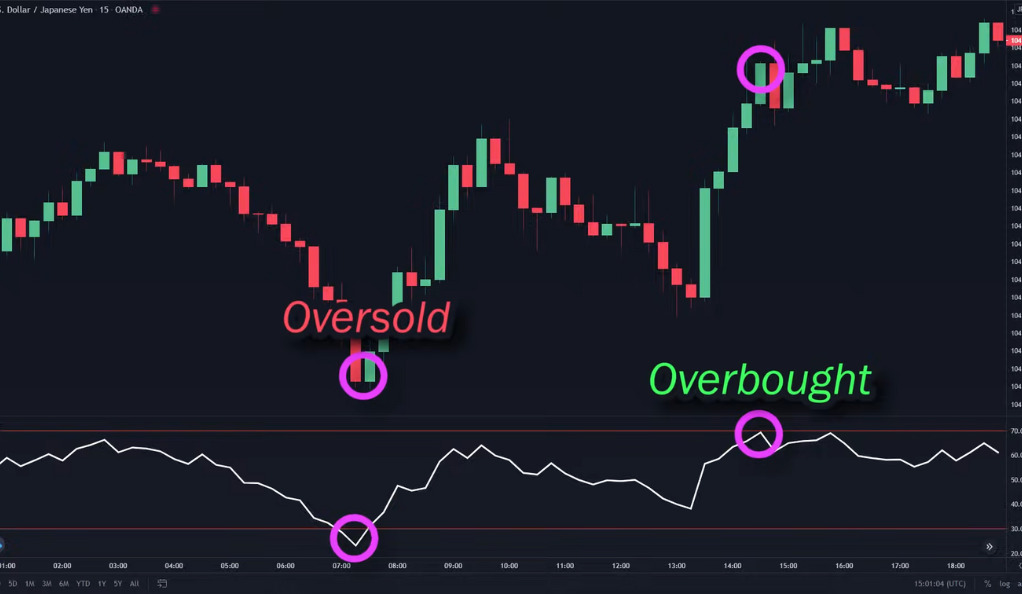
The Relative Strength Index (RSI) is akin to a versatile Swiss Army knife in the world of trading. It serves multiple functions, making it an indispensable tool for traders. One of its primary uses is to identify overbought and oversold levels in the market. When the RSI indicates an oversold condition while the price is approaching a key support level, it provides a more accurate signal for potential buying opportunities. This combination suggests that selling pressure may be exhausted, and a reversal or bounce-back in price could be imminent. By utilizing the RSI to identify these confluences, traders can make more informed decisions and potentially capture profitable trades.
In addition to its role in detecting overbought and oversold levels, the RSI can also serve as a trend indicator. When the RSI crosses above a certain threshold line, it can be seen as a bullish signal, suggesting an upward trend may be gaining strength. Conversely, if the RSI crosses below the threshold line, it can be interpreted as a bearish signal, indicating a potential downtrend. By incorporating the RSI as a trend indicator, traders can align their positions with the prevailing market direction, enhancing the likelihood of successful trades.
The MACD: Simple and Effective
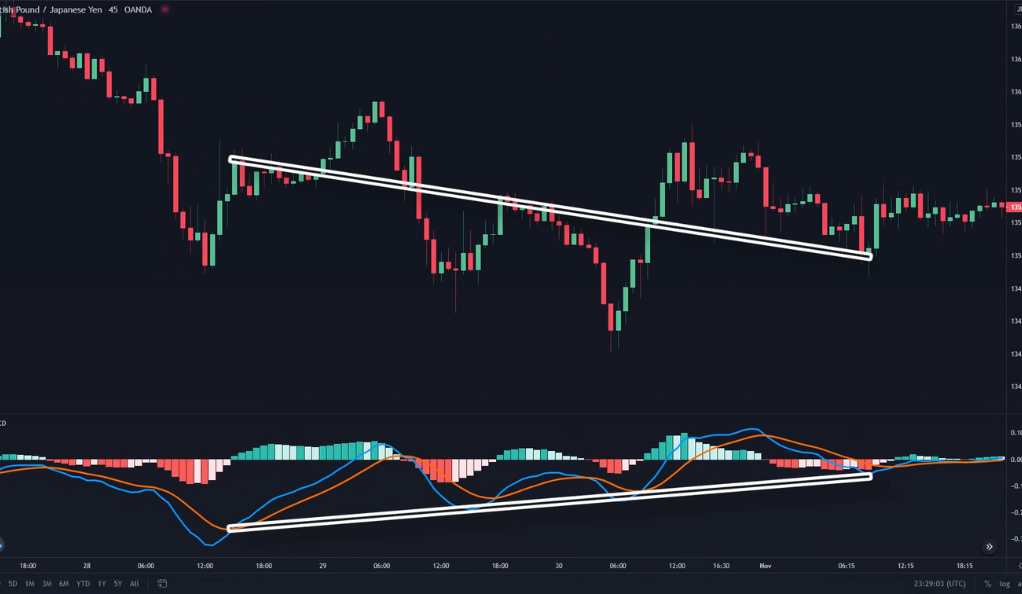
The Moving Average Convergence Divergence (MACD) is renowned for its simplicity and ability to generate high win rates in trading. One popular strategy utilizing the MACD is known as MACD divergence. This strategy involves identifying discrepancies between the MACD indicator and the price action, which can signal potential reversals in the market. When the price forms higher highs while the MACD forms lower highs (bearish divergence) or when the price forms lower lows while the MACD forms higher lows (bullish divergence), it suggests a weakening of the prevailing trend and a possible trend reversal. By incorporating MACD divergence into their analysis, traders can capture profitable trading opportunities with a relatively simple and effective approach.
Another profitable strategy involving the MACD is combining it with a 200 EMA (Exponential Moving Average). The 200 EMA is a long-term trend indicator, and when combined with the MACD, it can provide further confirmation for trade entries. For instance, if the MACD is below the histogram and the blue line crosses above the orange line while the price is positioned above the 200 EMA, it signals a potential buying opportunity. Conversely, if the MACD is above the histogram and the blue line crosses below the orange line while the price is below the 200 EMA, it indicates a potential selling opportunity. This simple combination of conditions allows traders to align their positions with both the short-term momentum indicated by the MACD and the long-term trend represented by the 200 EMA.
The ATR: Predicting Market Volatility
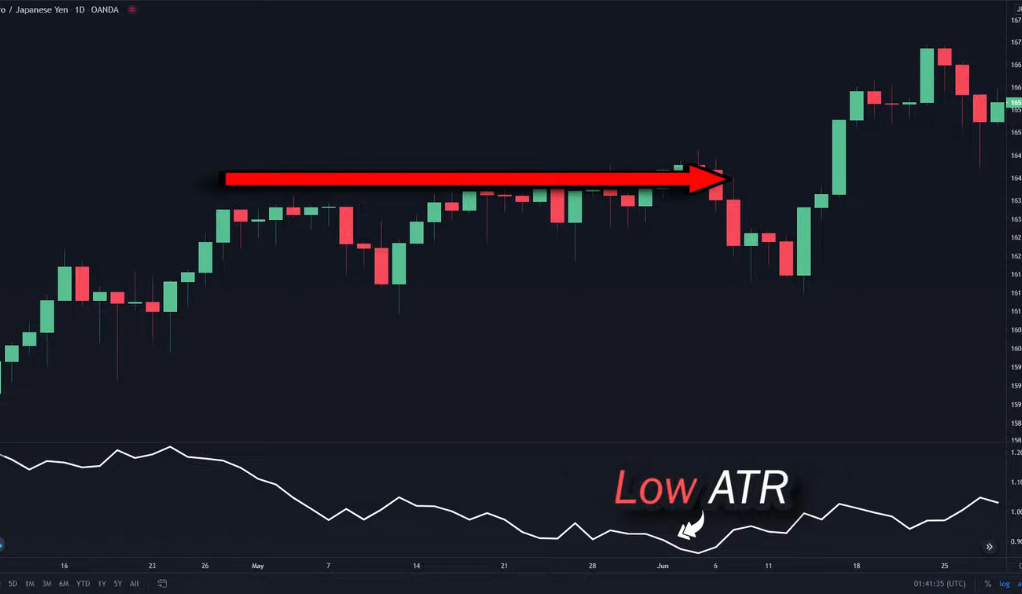
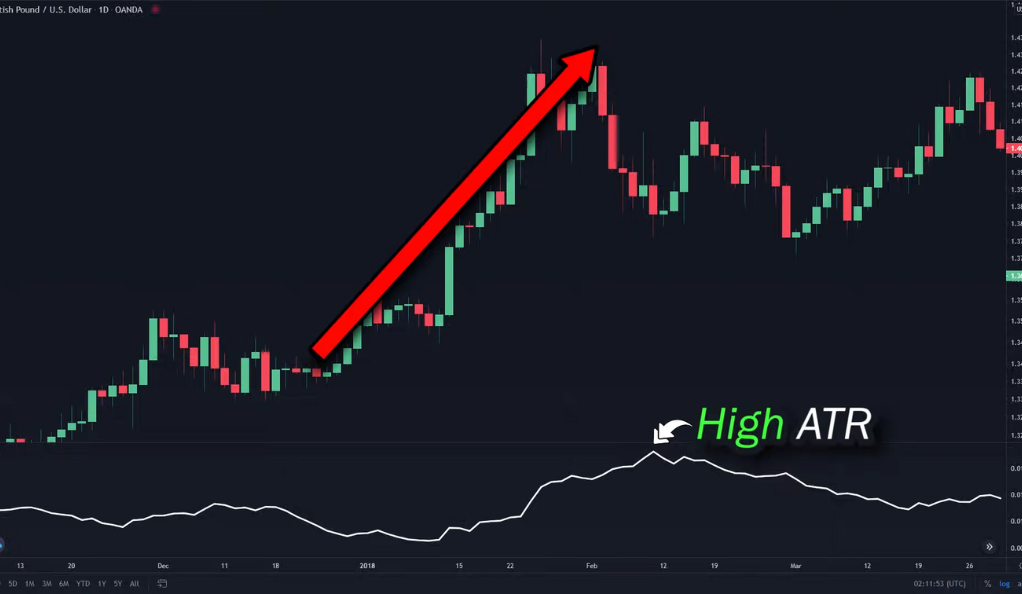
The Average True Range (ATR) is a valuable indicator that enables traders to predict market volatility, which is a crucial factor in trading. By analyzing the ATR, traders can gain insights into the current level of volatility in the market. When the ATR reading is low, it suggests that the market is experiencing a period of low volatility and may be relatively flat. Conversely, when the ATR reading is high, it indicates that the market is experiencing increased volatility, which often leads to larger price movements and potentially more profitable trading opportunities. By understanding and utilizing the information provided by the ATR, traders can adjust their strategies and adapt their risk management techniques accordingly.
In addition to predicting market volatility, the ATR can be a useful tool for determining optimal stop loss and take profit levels. The ATR can help traders set appropriate levels for stop losses, taking into account the volatility of the market. By incorporating the ATR-based trailing stop loss, traders can dynamically adjust their stop loss levels based on changes in market volatility. This approach allows for a more adaptive and effective risk management strategy, preventing traders from being stopped out prematurely during periods of heightened volatility. It helps to protect profits by giving trades more room to develop, while still providing a level of protection against adverse market movements.
Conclusion
In the world of trading, strategies are not one-size-fits-all. What works for one trader might not work for another. However, these top 5 high win rate trading strategies have proven their effectiveness time and time again. Whether you’re a seasoned trader or a beginner, these strategies can provide a solid foundation for your trading journey. Remember, the key to successful trading is not just about the strategies you use, but also about discipline, patience, and risk management.
Ainu Token aims to offer impartial and trustworthy information on cryptocurrency, finance, trading, and shares. However, we don't provide financial advice and recommend users to conduct their own studies and thorough checks.
Comments (No)